EXHIBIT 99.1
Published on June 2, 2009

1
NAREIT Investor Forum
Wednesday, June 3, 2009
and
Thursday, June 4, 2009

2
• Business Overview
• Summary of 1st Quarter
2009
• Summary of 2008 Financial Results
• Development Update
• Financial Strategies
• 2009 Challenges
• History of Consistent Success & Investor Reward

3
Business Overview
4
4
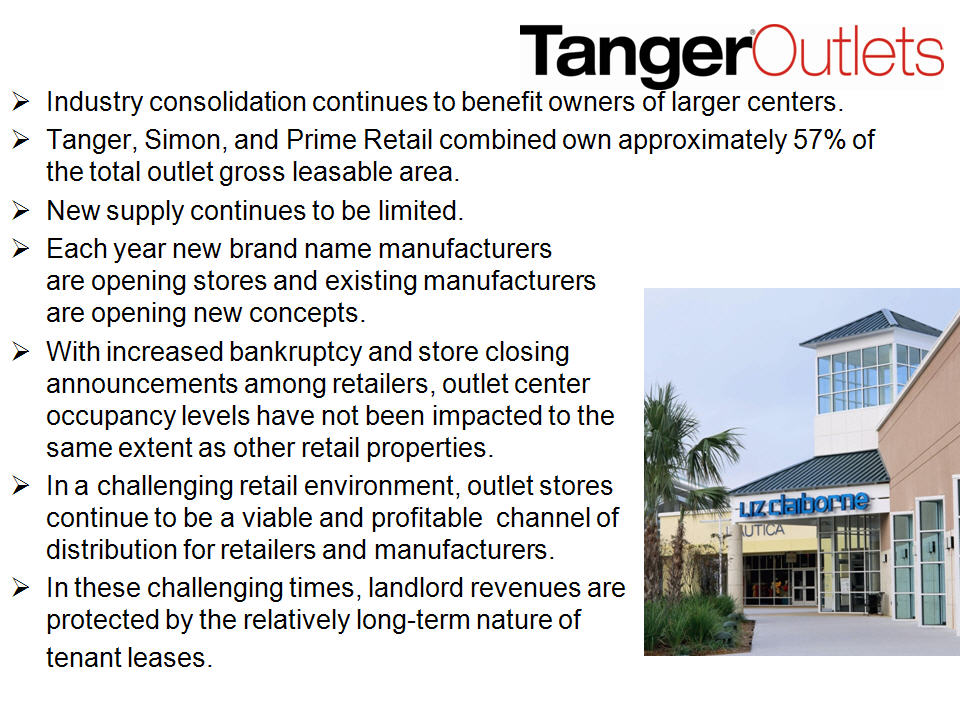
State of the Industry
Tanger - Myrtle Beach - Hwy 17, SC
5
5
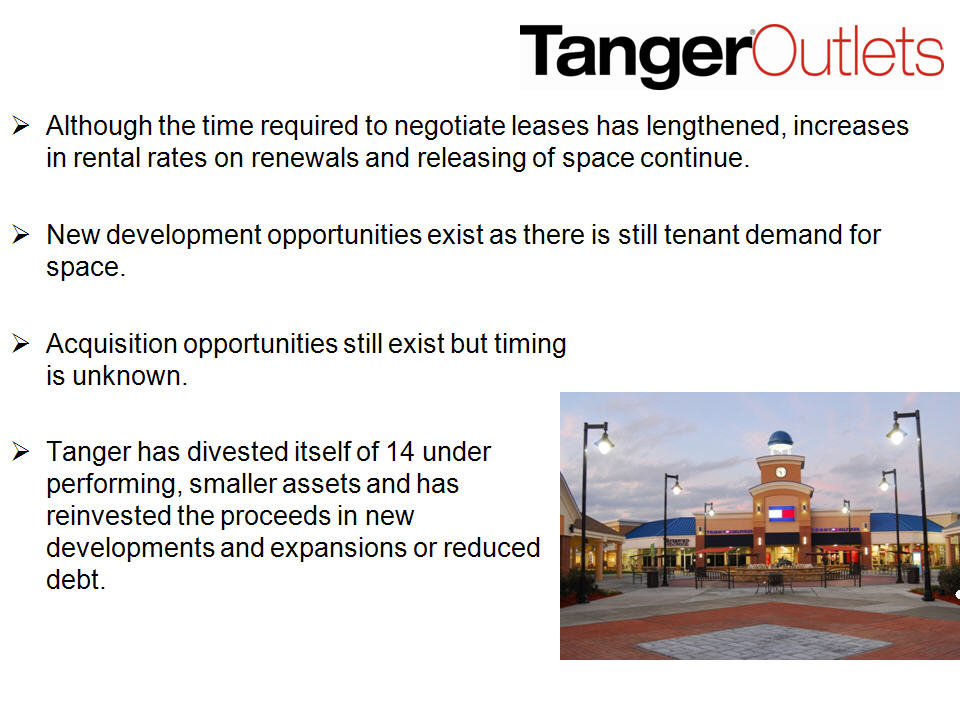
Tanger - Myrtle Beach - Hwy 501, NC
Growth Prospects

6
1st Quarter 2009 Highlights

7
§ 11.9% increase in FFO per share to $0.66 from $0.59 for 1Q08.
§ 2.4% increase in same center NOI.
§ Quarter end occupancy of 93.5% for stabilized,
wholly-owned properties.
§ Comparable tenant sales decreased 3.2% to $338
per square foot.
§ Completed an exchange offer on May 8, 2009
resulting in the retirement of
$142.3 million of Exchangeable Notes and the issuance of approximately 4.9
million common shares. This represents 95.2% of the Exchangeable Notes that
have an initial put date of August 2011. For each $1,000 Note tendered, holders
received 34.2079 common shares.
$142.3 million of Exchangeable Notes and the issuance of approximately 4.9
million common shares. This represents 95.2% of the Exchangeable Notes that
have an initial put date of August 2011. For each $1,000 Note tendered, holders
received 34.2079 common shares.

Impact of Exchange Offer
(Debt to Equity Conversion)
(Debt to Equity Conversion)
8
Key Financial Ratios as of March 31, 2009:
Actual
Pro-forma*
Limit
Key Bond Covenants (based on GAAP consolidation)
Total debt to adjusted total assets
53%
44%
60%
Secured debt to adjusted total assets
2%
2%
40%
Unencumbered assets to unsecured debt
186%
223%
135%
Interest coverage
3.65 x
4.55 x
2.00 x
* Reflects the reduction in debt that resulted from the exchange offer completed May 8, 2009.
9
9
8.4%
4.7%
3.3%
3.3%
3.2%
2.9%
2.8%
2.5%
2.3%
64.4%
The Gap
PVH
Nike
Adidas
VF
Liz
Dress
Barn
Barn
Carters
Polo
Other
Retailers
Note: As of March 31, 2009
Portfolio Diversification
2.2%
Jones
Retail
Corp
Retail
Corp
10
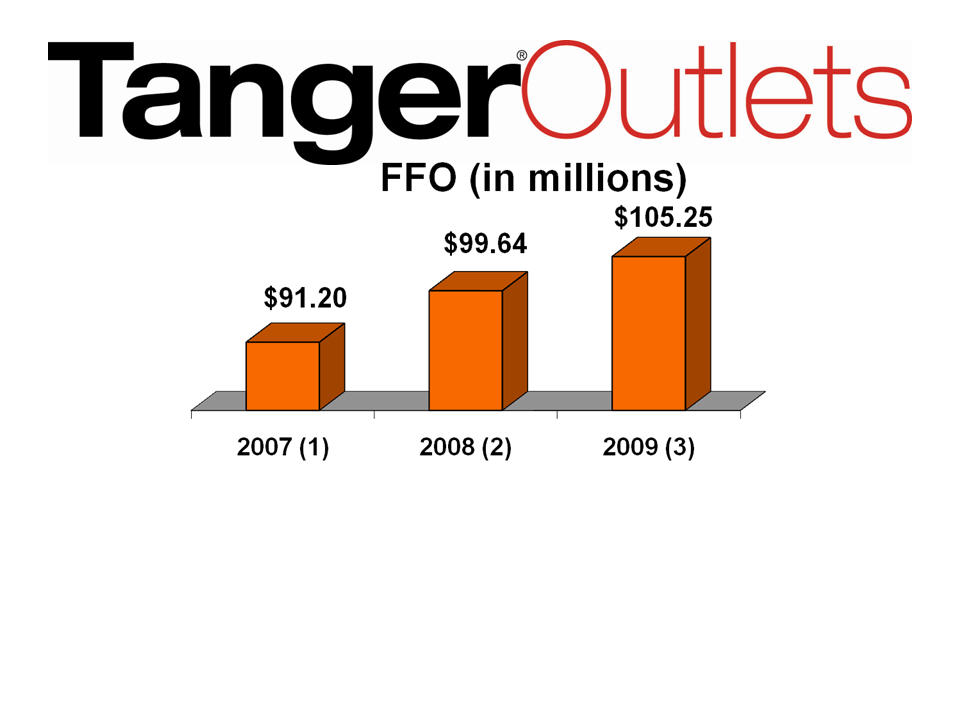
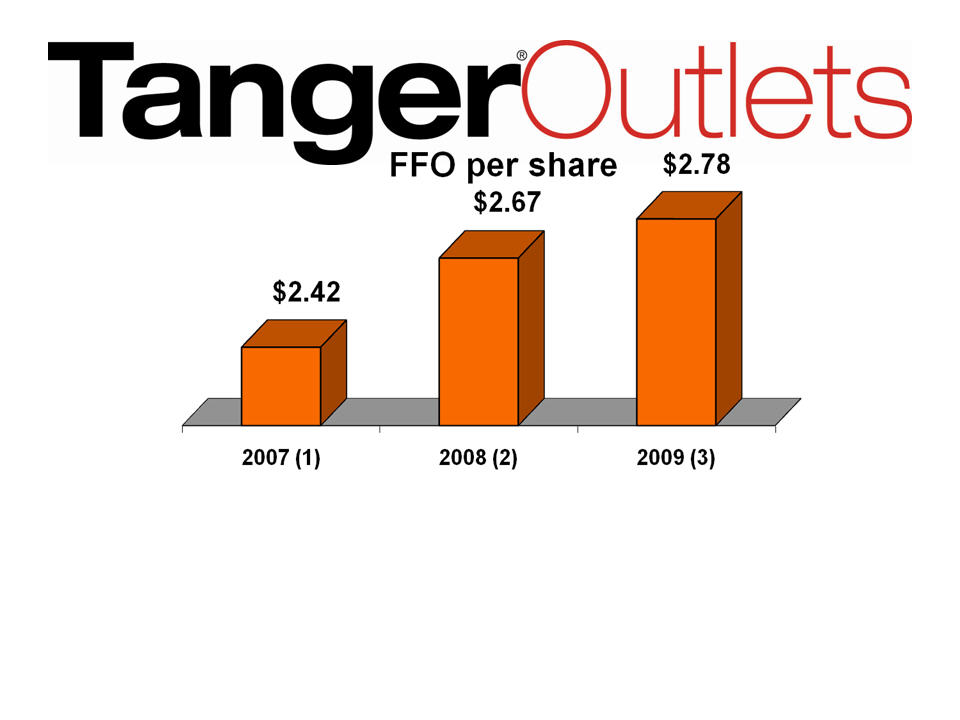
5.6%
Increase
(1) After FSP 14-1 restatement of interest expense related to 2026 Exchangeable Notes.
(2) Excludes $2.2 million termination rents, $3.3 million abandonment of due diligence costs,
$8.9 million charge for settlement of T-locks, $406,000 debt prepayment premium. Reduced to
reflect accounting change requiring recognition of interest expense on convertible debt at
market rate, rather than the lower, stated rate.
$8.9 million charge for settlement of T-locks, $406,000 debt prepayment premium. Reduced to
reflect accounting change requiring recognition of interest expense on convertible debt at
market rate, rather than the lower, stated rate.
(3) Represents the midpoint of $2.73 to $2.83 guidance range before adjustment for the dilutive
effect of the exchange offer completed on 05/08/09. Excludes a gain on debt extinguishment of
approximately $10.8 million to be recognized during the second quarter.
effect of the exchange offer completed on 05/08/09. Excludes a gain on debt extinguishment of
approximately $10.8 million to be recognized during the second quarter.
11
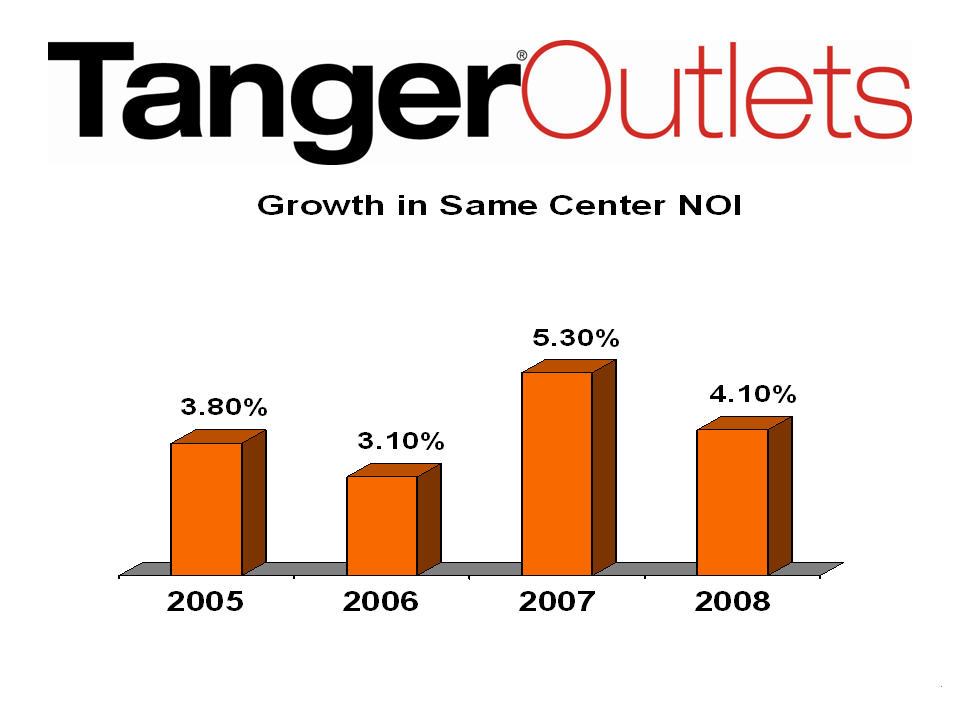
4.1%
Increase
Increase
(1) After FSP 14-1 restatement of interest expense related to 2026 Exchangeable Notes.
(2) Excludes $2.2 million termination rents, $3.3 million abandonment of due diligence costs,
$8.9 million charge for settlement of T-locks, $406,000 debt prepayment premium. Reduced to
reflect accounting change requiring recognition of interest expense on convertible debt at market
rate, rather than the lower, state rate.
$8.9 million charge for settlement of T-locks, $406,000 debt prepayment premium. Reduced to
reflect accounting change requiring recognition of interest expense on convertible debt at market
rate, rather than the lower, state rate.
(3) Represents the midpoint of $2.73 to $2.83 guidance range before adjustment for the dilutive
effect of the exchange offer completed on 05/08/09. Excludes a gain on debt extinguishment of
approximately $10.8 million to be recognized during the second quarter.
effect of the exchange offer completed on 05/08/09. Excludes a gain on debt extinguishment of
approximately $10.8 million to be recognized during the second quarter.
12
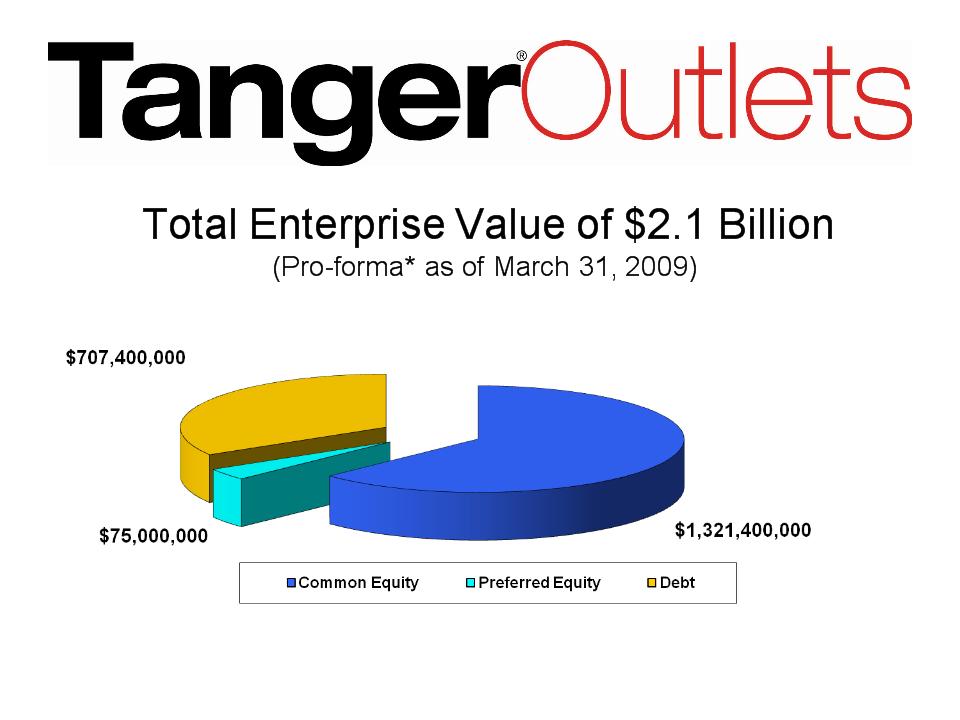
34%
63%
3%
* Reflects the reduction in debt and additional shares that resulted from the exchange offer
completed May 8, 2009.
completed May 8, 2009.

13
Summary of 2008 Financial Results
14
15
Straight-line releasing spreads = 44.1%
in 2008 (39.7% in 2007)
in 2008 (39.7% in 2007)
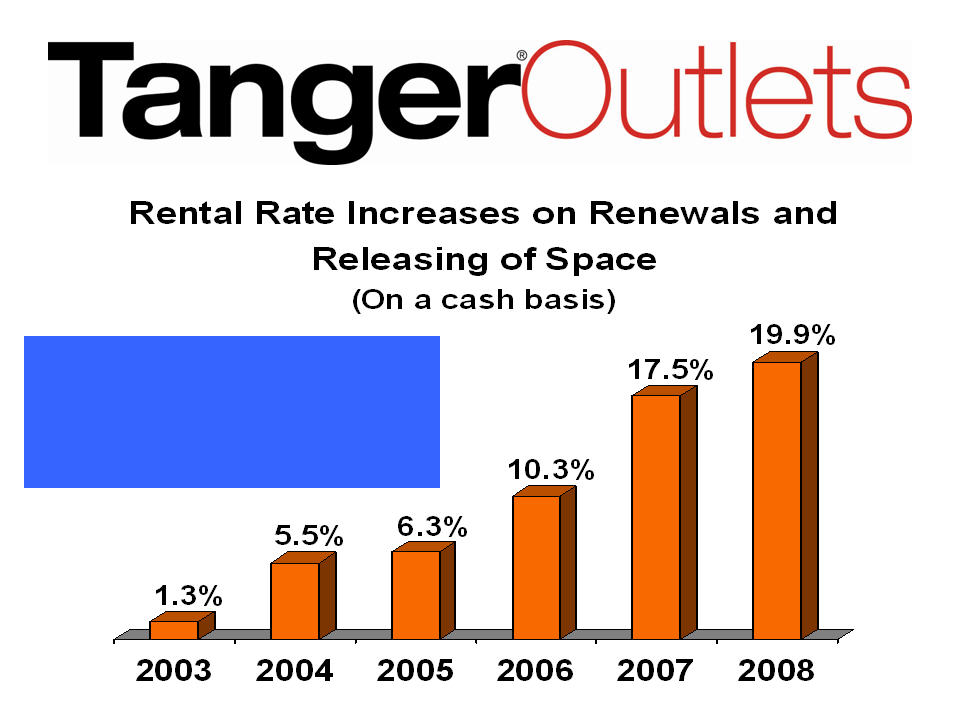
Straight-line renewal spreads =
17.5% in 2008 (13.9% in 2007)
17.5% in 2008 (13.9% in 2007)
17
18

19
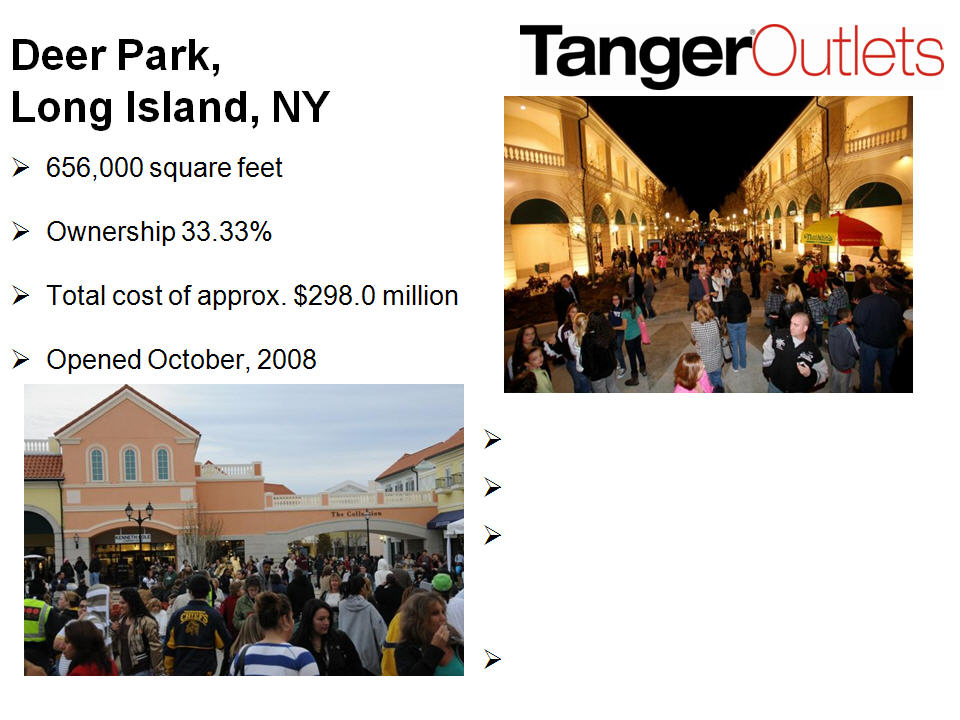
Development Update -
New Properties
20
20
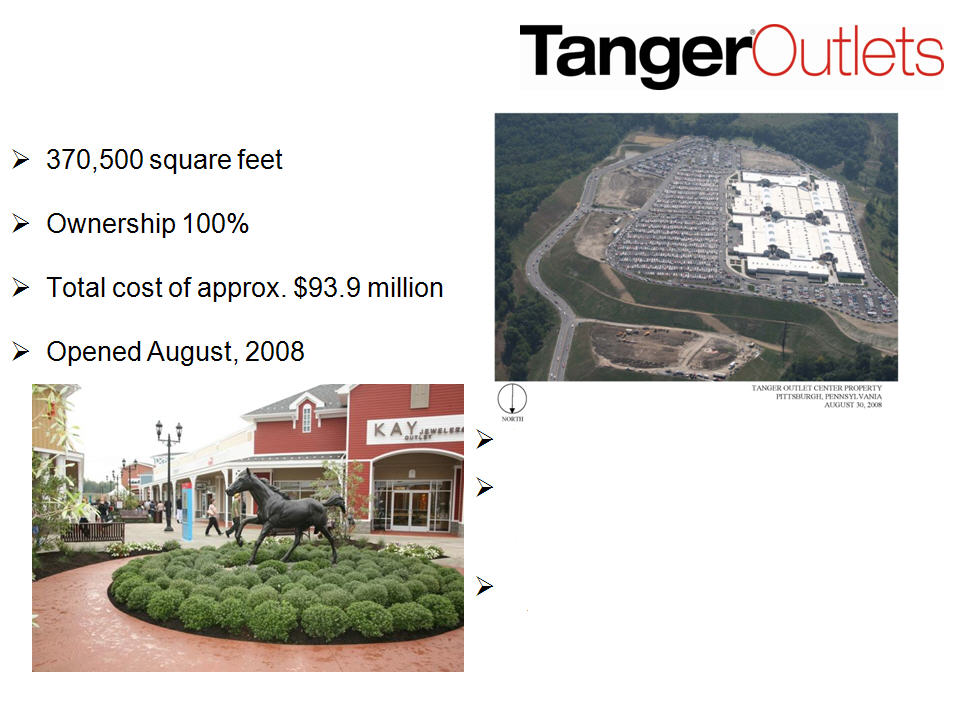
Washington, PA
(south of Pittsburgh)
(south of Pittsburgh)
82% leased at March 31, 2009
Construction financed through use
of lines of credit and tax increment
financing
of lines of credit and tax increment
financing
Estimated stabilized return on cost
of 10.0 to 10.5%
of 10.0 to 10.5%
21
21
78% leased at March 31, 2009
Unconsolidated JV
Construction financed through
$284.0 million mortgage loan
maturing May 2012 and partner
equity
$284.0 million mortgage loan
maturing May 2012 and partner
equity
Estimated stabilized return on cost
of 8.5% to 9.0%
of 8.5% to 9.0%

22
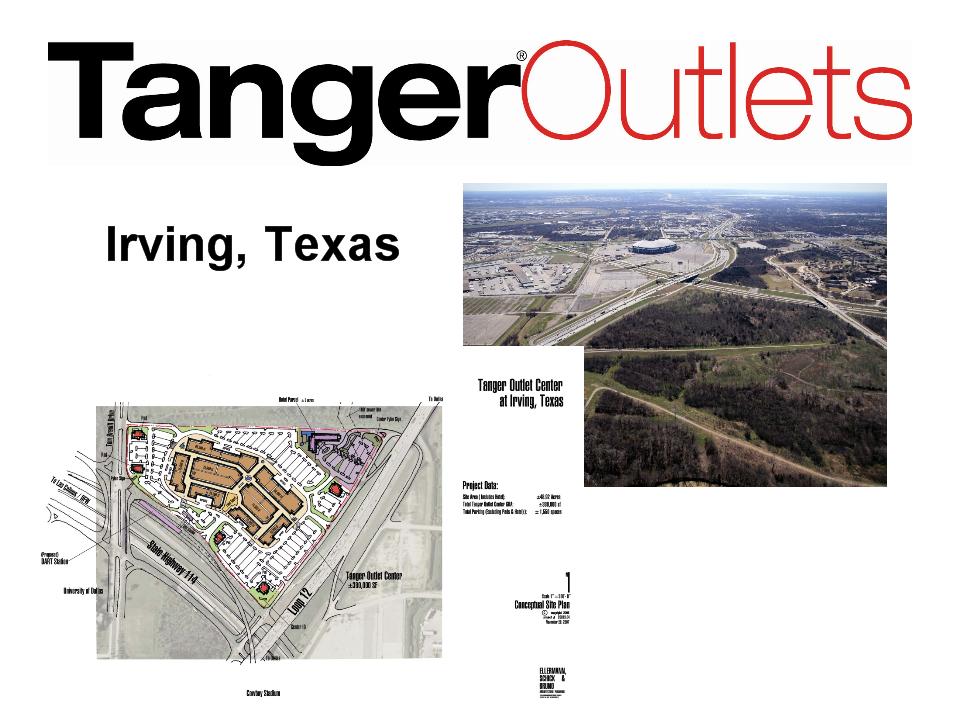
Development Update -
Pipeline

23
24

25
25
Internal Criteria for Development
Predevelopment costs are limited to those associated with:
Costs to control the
land (option contract costs)
Pre-leasing costs
Due diligence costs
Criteria required to purchase land and begin development
Positive results of
the due diligence process
Pre-leasing of 50%
or greater with an acceptable tenant mix and visibility for
leasing of the remaining leasable space to 75%
leasing of the remaining leasable space to 75%
Receipt of all non-appealable
permits required to obtain a building permit.
Acceptable return on cost analysis

26
Financial Strategies
27
27
Summary of Financial Strategies
The following are strategic objectives of Tanger’s financial decision
making process:
making process:
Focus on improving investment grade rating
Maintain quality coverage and leverage ratios
Continue the use of unsecured financing
Maintain relatively low usage on lines of credit
Use off balance sheet joint ventures only when
necessary
Maintain manageable levels of debt with staggered
maturities
Recycle capital through the sale of non-core
assets and land
parcels
parcels
Generate capital internally (cash flow in excess
of dividends paid)
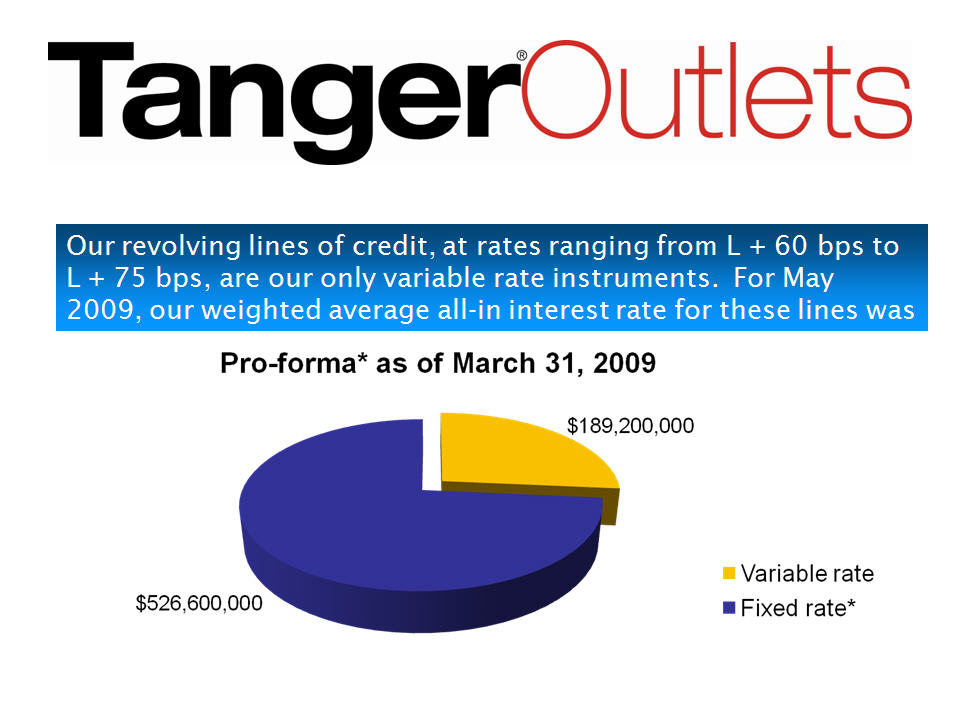
Limited Exposure to Rising Interest Rates
* Reflects the reduction in debt that resulted from the exchange offer completed 05/08/09.
28
29
29
Financial Capacity
Current capacity of $325 million under lines of credit
Bank of America, $100 million, 06/30/2011
maturity
Wells Fargo, $100 million, 06/30/2011 maturity
SunTrust, $40 million, 08/31/2011 maturity
BB&T, $35 million, 06/30/2011 maturity
Citicorp, $25 million, 06/30/2011 maturity
Wachovia, $25 million, 06/30/2009 maturity
Tanger’s line of credit usage is currently 60% of total available
capacity under lines of credit (as of May 19, 2009).
capacity under lines of credit (as of May 19, 2009).
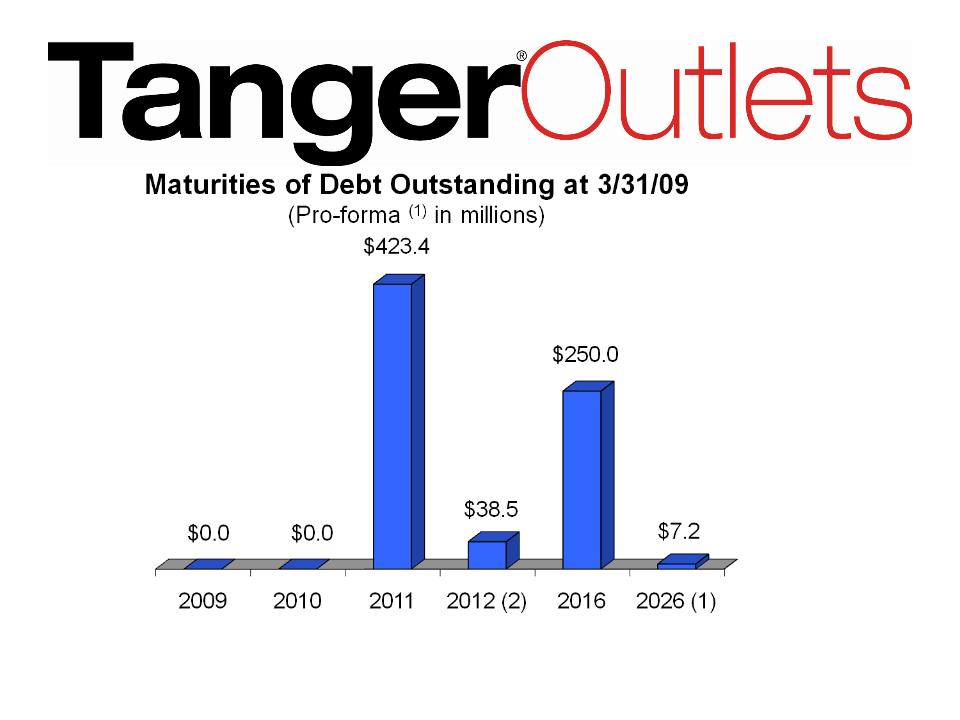
30
1. Represents convertible debt remaining after completion of exchange offer on 05/08/09.
Matures August 2026, but puttable at the holders’ option in August 2011.
Matures August 2026, but puttable at the holders’ option in August 2011.
2. Debt assumed as part of acquisition of Myrtle Beach 17 on 01/05/2009.
31
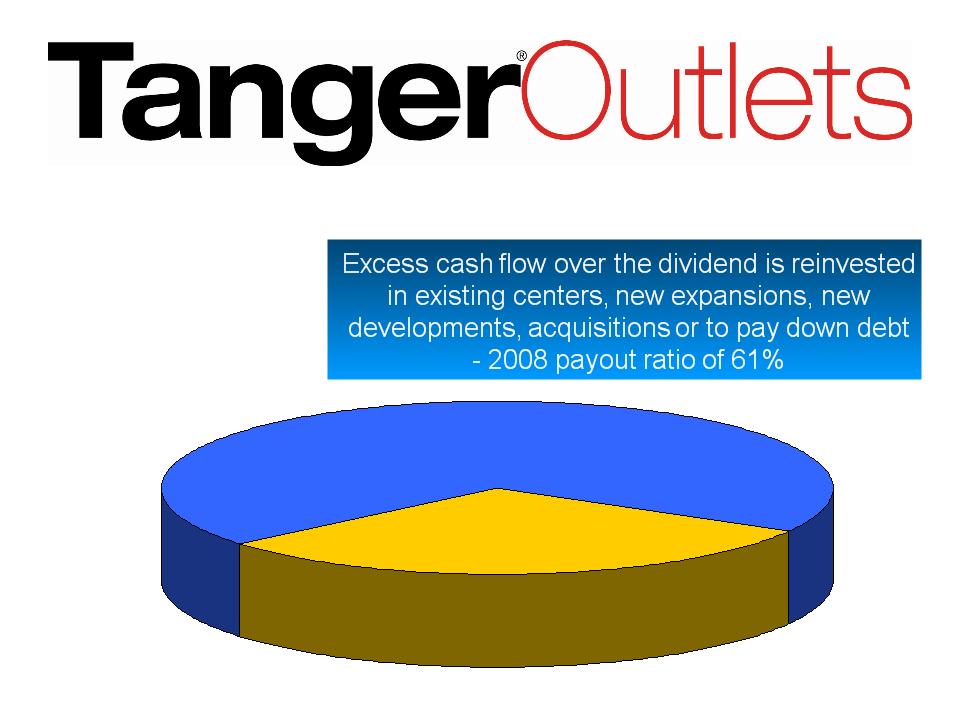
Reinvesting in the Company
$35.5 Million Excess Cash Flow
$56.4 Million Dividends

32
2009 Challenges

Lease Terminations 3Q07 through 1Q09
• Tenants 19
• Stores 131
• GLA 558,794
sf
• Average base rent $17.31
psf
• Base rental revenue $9.7 million
33
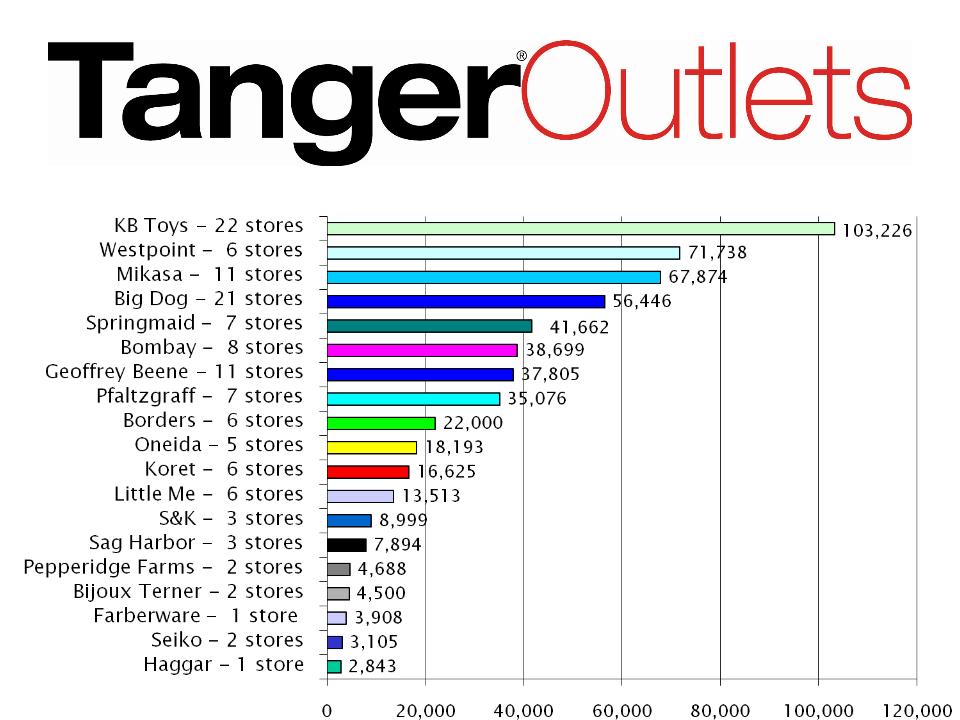
GLA Terminated by Tenant (sf)
34
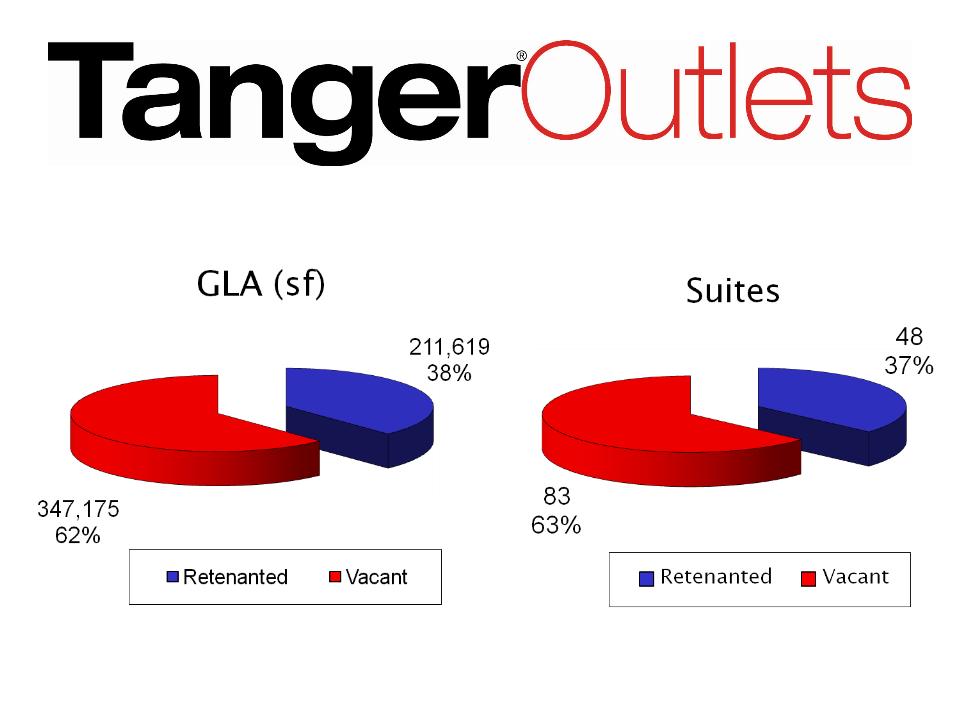
Re-Tenanting Activity
35
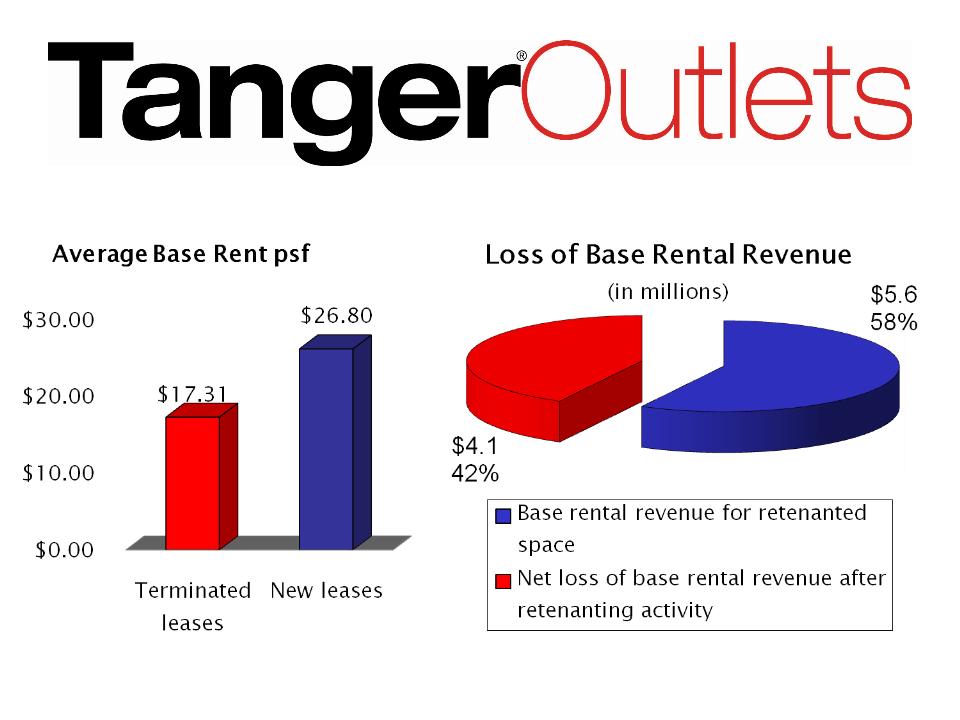
Re-Tenanting Activity
36
37
37
Liquidity and access to capital
Line of credit capacity
Near term debt maturities
Rating agency ratings
Tenant’s performance in the Tanger portfolio
Analysis of Landlord Risk
Top Ten Tenants (in terms of Tanger revenues)
Tanger analyzes the following information for each of our
top ten tenants:

38
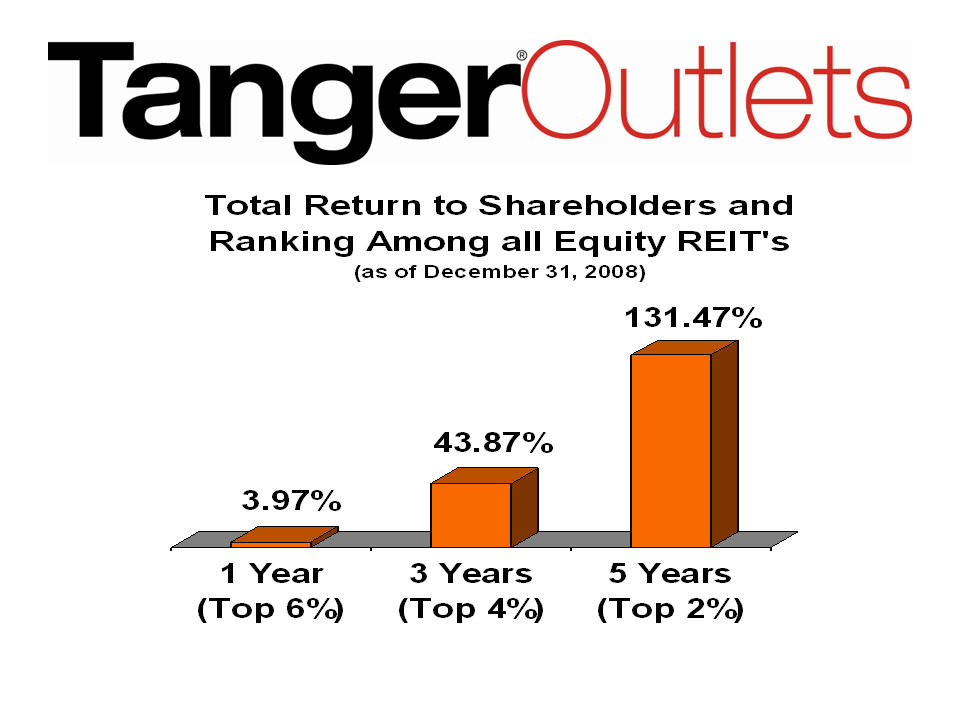
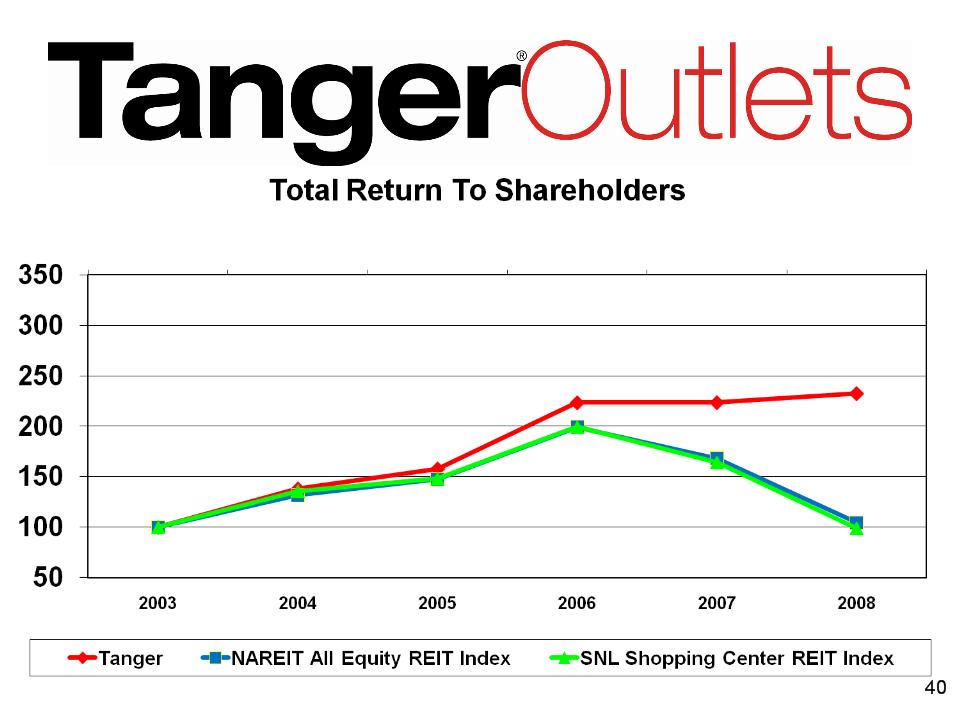
History of Consistent Results and
Investor Reward
Investor Reward
39

41
Summary
42
42
The strength and stability of our core operating portfolio, as well as the
strength of our balance sheet, leaves us poised to weather the current
economic conditions.
strength of our balance sheet, leaves us poised to weather the current
economic conditions.
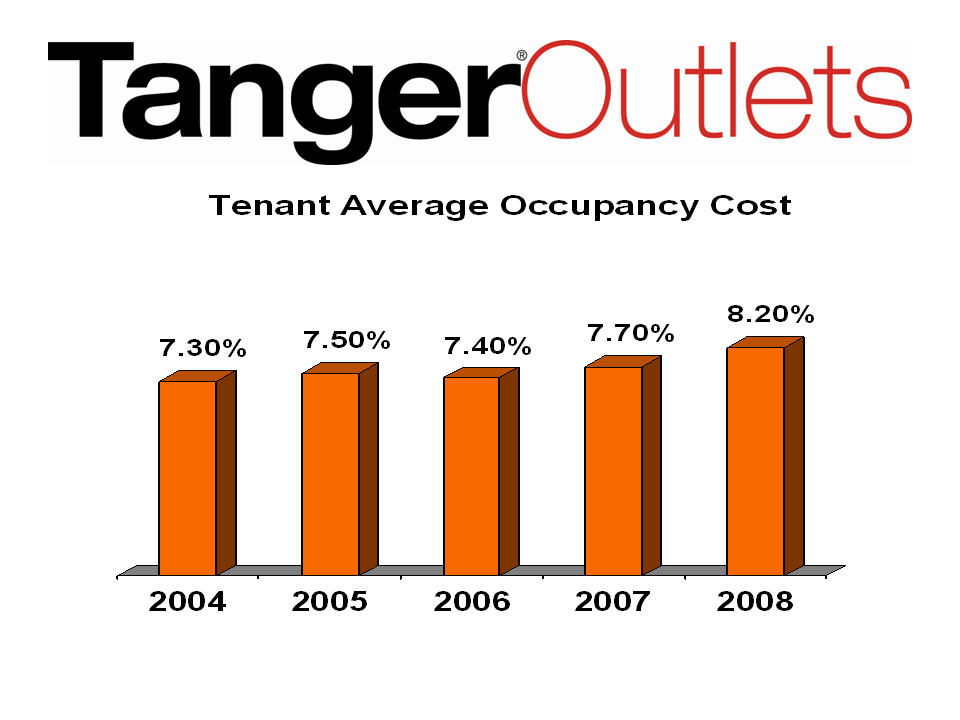
Low cost of occupancy helps
the outlet channel continue to be a
viable and profitable means of distribution for retailers and
manufacturers.
viable and profitable means of distribution for retailers and
manufacturers.
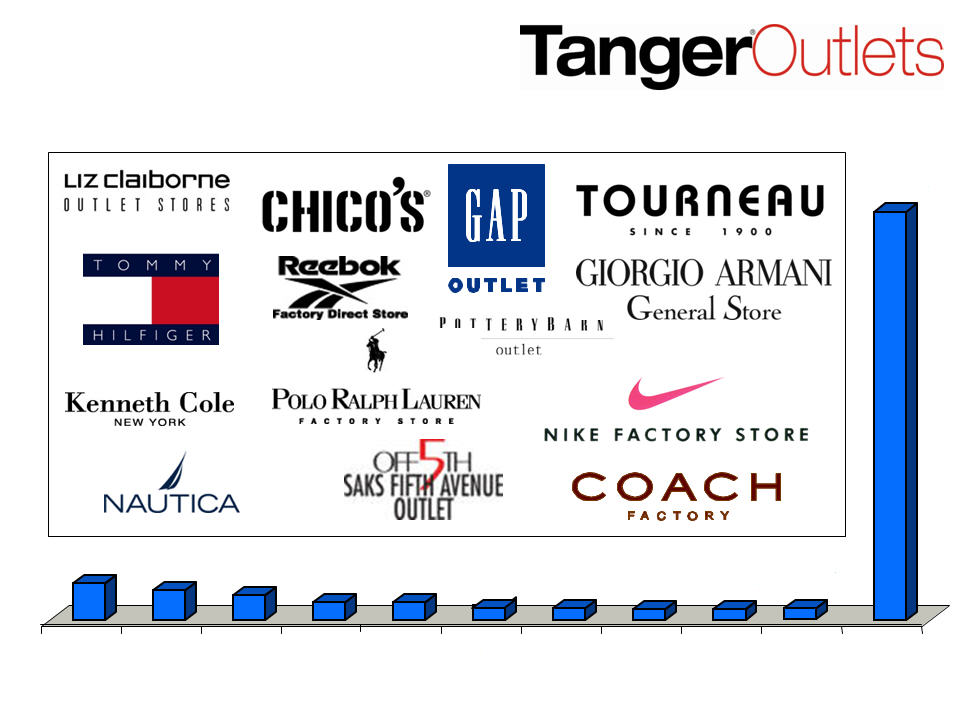
Tenant diversification provides
Tanger a distinct business advantage.
No single tenant represents more than 8.4% of our gross leasable
area or 5.3% of our total base and percentage rental income.
No single tenant represents more than 8.4% of our gross leasable
area or 5.3% of our total base and percentage rental income.
Geographical diversification of
our portfolio of 31 properties
throughout 21 states provides yet another Tanger advantage.
throughout 21 states provides yet another Tanger advantage.
Tenant Lease Term -
The typical Tanger lease term, about 5 years,
exceeds the duration of most economic downturns. Tenant rents are
fixed or escalate during the term of the lease.
exceeds the duration of most economic downturns. Tenant rents are
fixed or escalate during the term of the lease.
Strong brand reputation -
Shoppers have associated the Tanger
name with a superior shopping experience and true savings on the
best brand names in the nation for nearly 30 years.
name with a superior shopping experience and true savings on the
best brand names in the nation for nearly 30 years.
Summary

43
43
In these difficult economic times, our financial projections are both
conservative and achievable. In spite of increased projected
vacancy, we will be able to:
conservative and achievable. In spite of increased projected
vacancy, we will be able to:
Continue earnings growth
Increase average
rental rates on renewals and re-
tenanting
tenanting
Satisfy our cash requirements using net operating income
Maintain sufficient liquidity without additional required
financing until mid - 2011
financing until mid - 2011
Summary