EX-99.1
Published on February 24, 2026
EXHIBIT 99.1

Earnings Release and
Supplemental Operating and Financial Data for the
Quarter and Year Ended December 31, 2025
Table of Contents
| Section | |||||
| Earnings Release | |||||
| Portfolio Data: | |||||
| Summary Operating Metrics | |||||
| Geographic Diversification | |||||
| Property Summary - Occupancy at End of Each Period Shown | |||||
| Portfolio Map | |||||
| Portfolio Occupancy at the End of Each Period | |||||
| Center Sales Per Square Foot Ranking | |||||
| Top 25 Tenants Based on Percentage of Total Annualized Base Rent | |||||
Lease Expirations | |||||
| Capital Expenditures | |||||
| Transaction Summary | |||||
| Leasing Activity | |||||
| Financial Data: | |||||
| Consolidated Balance Sheets | |||||
| Consolidated Statements of Operations | |||||
| Components of Rental Revenues | |||||
| Unconsolidated Joint Venture Information | |||||
| Debt Outstanding Summary | |||||
| Future Scheduled Principal Payments | |||||
| Interest Rate Swap Strategy, Financial Covenants and Credit Ratings | |||||
| Enterprise Value, Net Debt, Liquidity and Debt Ratios | |||||
| Non-GAAP and Supplemental Measures: | |||||
| FFO and FAD Analysis | |||||
| Portfolio NOI and Same Center NOI | |||||
| Adjusted EBITDA and EBITDAre | |||||
| Net Debt | |||||
| Pro Rata Balance Sheet Information | |||||
| Pro Rata Statement of Operations Information | |||||
| Guidance for 2026 | |||||
| Non-GAAP Definitions | |||||
| Investor Information | |||||
News Release
Tanger Reports Fourth Quarter and Full Year 2025 Results and Introduces 2026 Guidance
Differentiated Platform Driving Sustained Growth
Robust Tenant Demand Drives Record Leasing Velocity
Recent Financing Transactions Further Enhance Balance Sheet Liquidity and Flexibility
Greensboro, NC, February 24, 2026, Tanger® (NYSE:SKT), a leading owner and operator of outlet and open-air retail shopping destinations, today reported financial results and operating metrics for the three months and year ended December 31, 2025.
“I am pleased to report another strong quarter, capping a productive year and positioning Tanger for continued growth in 2026,” said Stephen Yalof, President and Chief Executive Officer. “Our differentiated platform continues to deliver meaningful internal and external growth. Robust retailer demand and continued consumer interest is fueling same center NOI increases and driving growth at our recently acquired centers. We achieved record annual leasing volume, advanced our strategic merchandising initiatives, and strengthened our occupancy, all of which reflect the confidence brands have in partnering with Tanger.”
Mr. Yalof continued, “Additionally, we are benefitting from powerful demographic and economic catalysts across our markets, reinforcing our position as the focal points of thriving, dynamic communities. With a flexible balance sheet that we further strengthened in early 2026, a solid leasing pipeline, and growing momentum across our platform, Tanger remains well‑positioned to create long‑term value for our stakeholders.”
Fourth Quarter Results
•Net income available to common shareholders was $0.29 per share, or $33.2 million, compared to $0.23 per share, or $26.3 million, for the prior year period.
•Funds From Operations (“FFO”) available to common shareholders was $0.63 per share, or $75.6 million, compared to $0.54 per share, or $63.3 million, for the prior year period.
•Core Funds From Operations (“Core FFO”) available to common shareholders was $0.63 per share, or $75.6 million, compared to $0.54 per share, or $63.3 million, for the prior year period.
Full Year Results
•Net income available to common shareholders was $0.99 per share, or $113.9 million, compared to $0.88 per share, or $97.7 million, for the prior year period. Net income for 2025 includes a non-cash impairment charge of $0.04 per share, or $4.2 million, related to the center in Howell, Michigan that was sold in April 2025.
•FFO available to common shareholders was $2.33 per share, or $278.0 million, compared to $2.12 per share, or $245.4 million, for the prior year period.
•Core FFO available to common shareholders was $2.33 per share, or $278.0 million, compared to $2.13 per share, or $247.0 million, for the prior year period.
FFO and Core FFO are widely accepted supplemental non-GAAP financial measures used in the real estate industry to measure and compare the operating performance of real estate companies. Definitions of these non-GAAP financial measures and statements of the reasons why management believes these non-GAAP financial measures provide useful information to investors about the Company’s financial condition and results of operations, and, if applicable, the other purposes for which management uses the measures, as well as reconciliations of these non-GAAP financial measures to GAAP net income, can be found later in this release. Per share amounts for net income, FFO and Core FFO are on a diluted basis.
Operating Metrics
Below are key portfolio results for the total portfolio, including the Company’s pro rata share of unconsolidated joint ventures.
•Occupancy was 98.1% on December 31, 2025, compared to 97.4% on September 30, 2025 and 98.0% on December 31, 2024. On a same center basis, occupancy was 98.2% on December 31, 2025, compared to 97.6% on September 30, 2025 and 98.1% on December 31, 2024. The same center portfolio excludes Pinecrest and Tanger Kansas City at Legends, which were acquired during 2025, and the sold center in Howell, Michigan for all periods presented.
i
•Same center net operating income (“Same Center NOI”), which is presented on a cash basis, increased 5.6% to $107.3 million for the fourth quarter of 2025 from $101.5 million for the fourth quarter of 2024 and increased 4.3% to $407.7 million for the full year of 2025 from $390.8 million for the full year of 2024.
•Average tenant sales per square foot was $473 for the twelve months ended December 31, 2025 compared to $475 for the twelve months ended September 30, 2025 and $443 for the twelve months ended December 31, 2024, reflecting the Company’s execution of its strategy to remerchandise, replace less productive tenants, and evolve its portfolio.
•On a same center basis, average tenant sales per square foot was $474 for the twelve months ended December 31, 2025 compared to $475 for the twelve months ended September 30, 2025 and $447 for the twelve months ended December 31, 2024. The same center portfolio excludes Pinecrest, Tanger Kansas City at Legends, Tanger Outlets Nashville and the sold center in Howell, Michigan.
•The occupancy cost ratio (“OCR”), representing annualized occupancy costs as a percentage of tenant sales, was 9.7% for the twelve months ended December 31, 2025 compared to 9.7% for the twelve months ended September 30, 2025 and 9.5% for the twelve months ended December 31, 2024.
•Lease termination fees (which are excluded from Same Center NOI) for the total portfolio totaled $333,000 for the fourth quarter of 2025 and $1.1 million for the full year of 2025, compared to $30,000 for the fourth quarter of 2024 and $955,000 for the full year of 2024.
Same Center NOI is a supplemental non-GAAP financial measure of operating performance. A complete definition of Same Center NOI and a reconciliation to the nearest comparable GAAP measure can be found later in this release.
Leasing Activity
Leasing activity in the Company’s portfolio continues to be robust from both existing and new tenants. For the total domestic portfolio, including the Company’s pro rata share of domestic unconsolidated joint ventures, total renewed or re-tenanted leases (including leases for both comparable and non-comparable space) executed during the twelve months ended December 31, 2025 included 630 leases, totaling 3.1 million square feet, compared to 532 leases, totaling 2.4 million square feet, during the twelve months ended December 31, 2024.
Blended average rental rate spreads were 9.5% on a cash basis for leases executed for 2.8 million square feet of comparable space during the twelve months ended December 31, 2025. These blended rent spreads are comprised of re-tenanted rent spreads of 28.3% and renewal rent spreads of 6.5%.
As of January 31, 2026, the Company had renewals executed or in process for 46% of the space scheduled to expire during 2026 compared to 35% of expiring 2025 space as of January 31, 2025 (total portfolio, including the Company’s pro rata share of unconsolidated joint ventures).
Balance Sheet and Liquidity
The following balance sheet and liquidity metrics are presented for the total portfolio, including the Company’s pro rata share of unconsolidated joint ventures. As of December 31, 2025:
•Net debt to Adjusted EBITDAre was 4.7x for the twelve months ended December 31, 2025 compared to 5.0x for the twelve months ended September 30, 2025 and 4.8x for the year ended December 31, 2024. Net debt to Adjusted EBITDAre is calculated as Net debt divided by Adjusted Earnings Before Interest, Taxes, Depreciation and Amortization for Real Estate (“Adjusted EBITDAre”).
•Interest coverage ratio (calculated as Adjusted EBITDAre divided by interest expense) was 4.8x for 2025 compared to 4.6x for 2024.
•Cash and cash equivalents totaled $27.8 million with $576.0 million of availability on the Company’s $620.0 million unsecured lines of credit. Additionally, the Company had $35.4 million of restricted cash.
•Total outstanding debt aggregated $1.8 billion with $44.0 million (principal) of floating rate debt, representing approximately 2% of total debt outstanding and approximately 1% of total enterprise value.
•Weighted average interest rate was 4.1%, including current swaps, and weighted average term to maturity of outstanding debt, including extension options, was approximately 2.8 years.
•Approximately 88% of the total portfolio’s square footage was unencumbered by mortgages, with secured debt of $341.1 million (principal), representing approximately 19% of total debt outstanding.
•Funds Available for Distribution (“FAD”) payout ratio was 61% for 2025.
Adjusted EBITDAre, Net debt and FAD are supplemental non-GAAP financial measures of operating performance. Definitions of Adjusted EBITDAre, Net debt and FAD and reconciliations to the nearest comparable GAAP measures are included later in this release.
ii
In December 2025, the mortgage for the Company’s Southaven, MS (Memphis) center was amended to remove the 10-basis point Secured Overnight Financing Rate (“SOFR”) credit adjustment spread.
January 2026 Financing Transactions
In January 2026, as discussed further below, the Company completed a series of financing transactions that increased the Company’s debt capacity, enhanced liquidity, extended debt duration, lowered pricing, and expanded its bank group. “With over $1 billion of current liquidity available post these financing transactions, including significant cash on hand, delayed draws available on our new term loans, and full capacity under our lines of credit, Tanger is even better positioned with considerable financial flexibility to support operational needs, upcoming debt maturities, and our strategic growth initiatives to drive value for our stakeholders,” said Michael Bilerman, Chief Financial Officer and Chief Investment Officer.
Unsecured Term Loans
The Company closed on $550 million of unsecured term loans, comprised of (i) an amendment of the Company's existing $325 million term loan increasing capacity to $350 million and extending the maturity to December 2030 (the “2030 Term Loan”) and (ii) a new $200 million term loan due January 2033 (the “2033 Term Loan”). The Company drew an incremental $75 million of proceeds at closing, for a total outstanding of $400 million, and has a combined $150 million under a delayed draw feature, allowing the Company to draw the additional proceeds over a six-to-nine month period. The applicable pricing margin is SOFR plus 95 basis points for the 2030 Term Loan and SOFR plus 125 basis points for the 2033 Term Loan based on the Company’s current credit rating. The current 10-basis point SOFR credit adjustment spread was removed for the 2030 Term Loan, and the Company also amended its $600 million revolving credit facility and its $20 million liquidity line to remove the 10-basis point SOFR credit adjustment spread.
Exchangeable Senior Notes
Additionally, the Company issued $250 million aggregate principal amount of 2.375% Exchangeable Senior Notes due 2031 and entered into capped call transactions that increased the effective conversion price from approximately $41.55 per share to approximately $47.49 per share, subject to adjustments. The net proceeds of approximately $243 million were used to pay approximately $9 million of capped call transaction costs and repurchase approximately $20 million of the Company’s common shares.
The remaining proceeds from the term loans and the exchangeable notes were used to repay approximately $44 million of the outstanding debt under the unsecured lines of credit, with the remainder to be used to repay additional debt and general corporate purposes. Please see the Current Reports on Form 8-K filed with the Securities and Exchange Commission (“SEC”) on January 6, 2026 and January 12, 2026 for additional information on these transactions.
Forward-Starting Swaps
In December 2025 and January 2026, the Company entered into $75 million of forward-starting swaps that commenced on January 6, 2026 and mature on October 1, 2029 to address the additional $75 million of borrowings from the 2030 and 2033 Term Loans discussed above. Additionally, in January 2026, the Company entered into $50 million of forward-starting swaps that will commence on January 1, 2027 and mature between December 1, 2028 and September 1, 2030 to address a portion of the $175 million of existing swaps that expire on January 1, 2027. Please see the supplemental information package in the Current Report on Form 8-K furnished with the SEC on February 24, 2026 for additional information on these swaps.
Dividend
In January 2026, the Company’s Board of Directors authorized a quarterly cash dividend of $0.2925 per share, payable on February 13, 2026 to holders of record on January 30, 2026.
Guidance for 2026
Based on the Company’s internal budgeting process and its view on current market conditions, management currently believes the Company’s full-year 2026 net income and FFO per share will be as follows:
| For the year ending December 31, 2026: | ||||||||
| Low Range | High Range | |||||||
| Estimated diluted net income per share | $1.04 | $1.12 | ||||||
| Depreciation and amortization of real estate assets - consolidated and the Company’s share of unconsolidated joint ventures | 1.37 | 1.37 | ||||||
Estimated diluted FFO per share (1) | $2.41 | $2.49 | ||||||
(1) Amounts may not recalculate due to the effect of rounding.
iii
The above estimates reflect the following key assumptions (dollars in millions):
| For the year ending December 31, 2026: | ||||||||
| Low Range | High Range | |||||||
| Same Center NOI growth - total portfolio at pro rata share | 2.25 | % | 4.25 | % | ||||
| General and administrative expense | $80.5 | $83.5 | ||||||
| Interest expense, net of interest income - consolidated | $69.5 | $72.5 | ||||||
| Annual recurring capital expenditures, renovations and second generation tenant allowances | $65.0 | $75.0 | ||||||
Weighted average diluted common shares are expected to range from approximately 115.5 million to 116.5 million for earnings per share and 120.0 million to 121.0 million for FFO and Core FFO per share. Guidance does not include the impact of any additional acquisition or sale of any outparcels, properties or joint venture interests, or any additional financing activity.
Fourth Quarter and Full Year 2025 Conference Call
Tanger will host a conference call to discuss its fourth quarter and full year 2025 results for analysts, investors and other interested parties on Wednesday, February 25, 2026, at 8:30 a.m. Eastern Time. To access the conference call, listeners should dial 1-877-605-1702. Alternatively, a live audio webcast of this call will be available to the public on Tanger’s Investor Relations website, investors.tanger.com. A telephone replay of the call will be available from February 25, 2026 at approximately 11:30 a.m. through March 11, 2026 at 11:59 p.m. by dialing 1-877-660-6853, replay access code #13757571. An online archive of the webcast will also be available through March 11, 2026.
Upcoming Events
The Company is scheduled to participate in the following upcoming events:
•Wolfe Research Fifth Annual Real Estate Conference held virtually on February 26, 2026
•Citi’s 31st Annual Global Property CEO Conference held at the Diplomat Resort & Spa in Hollywood, FL from March 2 through March 4, 2026
•A tour of Tanger Outlets Phoenix on March 17, 2026 in connection with Evercore ISI’s Phoenix Multi-Sector Property Tour
•Bank of America’s Retail REIT Executive Summit in New York, NY on March 25, 2026
•A tour of Tanger Outlets Charleston on May 4, 2026 in connection with Wells Fargo’s 29th Annual Real Estate Securities Conference held at The Charleston Place in Charleston, SC from May 4 through May 6, 2026
•BMO’s North American Real Estate Conference held at the InterContinental New York Barclay in New York, NY on May 12, 2026
About Tanger®
Tanger Inc. (NYSE: SKT) is a leading owner and operator of outlet and open-air retail shopping destinations, with 45 years of expertise in the retail and outlet shopping industries. Tanger’s portfolio of 38 outlet centers and three open-air lifestyle centers includes more than 16 million square feet well positioned across tourist destinations and vibrant markets in 22 U.S. states and Canada. A publicly traded REIT since 1993, Tanger continues to innovate the retail experience for its shoppers with over 3,000 stores operated by more than 800 different brand name companies. Tanger is furnishing a Form 8-K with the SEC that includes a supplemental information package for the quarter and year ended December 31, 2025. For more information on Tanger, call 1-800-4TANGER or visit tanger.inc.
Tanger Inc. (together with its subsidiaries, the “Company”) uses, and intends to continue to use, its Investor Relations website, which can be found at investors.tanger.com, as a means of disclosing material nonpublic information and for complying with its disclosure obligations under Regulation FD. Additional information about the Company can also be found through social media channels. The Company encourages investors and others interested in the Company to review the information on its Investor Relations website and on social media channels. The information contained on, or that may be accessed through, our website or social media platforms is not incorporated by reference into, and is not a part of, this document.
Safe Harbor Statement
Certain statements made in this earnings release contain forward-looking statements within the meaning of Section 27A of the Securities Act of 1933, as amended, and Section 21E of the Securities Exchange Act of 1934, as amended. We intend such forward-looking statements to be covered by the safe harbor provisions for forward-looking statements contained in the Private Securities Litigation Reform Act of 1995 and include this statement for purposes of complying with these safe harbor provisions. Forward-looking statements are generally identifiable by use of the words “anticipate,” “believe,” “can,” “continue,” “could,”
iv
“designed,” “estimate,” “expect,” “forecast,” “goal,” “intend,” “may,” “might,” “plan,” “possible,” “potential,” “predict,” “project,” “should,” “target,” “will,” “would,” and similar expressions that do not report historical matters. Such statements are based on assumptions and expectations that may not be realized and are inherently subject to risks, uncertainties and other factors, many of which cannot be predicted with accuracy and some of which might not even be anticipated. Although we believe the expectations reflected in these forward-looking statements are based on reasonable assumptions, future events and actual results, performance, transactions or achievements, financial and otherwise, may differ materially from the results, performance, transactions or achievements expressed or implied by the forward-looking statements. As a result, you should not rely on or construe any forward-looking statements in this release as predictions of future events or as guarantees of future performance. We caution you not to place undue reliance on forward-looking statements, which speak only as of the date of this release. All of our forward-looking statements are qualified in their entirety by this statement.
There are a number of risks, uncertainties and other factors that could cause our actual results to differ materially from the forward-looking statements contained in or contemplated by this release. Any forward-looking statements should be considered in light of the risks, uncertainties and other factors referred to in Item 1A. “Risk Factors” in our most recent Annual Report on Form 10-K and our subsequent Quarterly Reports on Form 10-Q and in our other filings with the SEC. Such risks and uncertainties include, but are not limited to: risks associated with general economic and financial conditions, including inflationary pressures and recessionary fears; newly-imposed and potentially additional U.S. tariffs and responsive non-U.S. tariffs; increased capital costs and capital markets volatility; increases in unemployment and reduced consumer confidence and spending; risks related to our ability to develop new retail centers or expand existing retail centers successfully; risks related to the financial performance and market value of our retail centers and the potential for reductions in asset valuations and related impairment charges; our dependence on rental income from real property; the relative illiquidity of real property investments; failure of our acquisitions or dispositions of retail centers to achieve anticipated results; competition for the acquisition and development of retail centers, and our inability to complete the acquisitions of retail centers we may identify; competition for tenants with competing retail centers and our inability to execute leases with tenants on terms consistent with our expectations; the diversification of our tenant mix and our entry into the operation of full price retail may not achieve our expected results; risks associated with environmental regulations; risks associated with possible terrorist activity or other acts or threats of violence and threats to public safety; risks related to international military conflicts, international trade disputes and foreign currency volatility; the fact that certain of our leases include co-tenancy and/or sales-based provisions that may allow a tenant to pay reduced rent and/or terminate a lease prior to its natural expiration; our dependence on the results of operations of our retailers and their bankruptcy, early termination or closing could adversely affect us; the impact of geopolitical conflicts; the impact of a prolonged government shutdown; the immediate and long-term impact of the outbreak of a highly infectious or contagious disease on our tenants and on our business (including the impact of actions taken to contain the outbreak or mitigate its impact); the fact that certain of our properties are subject to ownership interests held by third parties, whose interests may conflict with ours; risks related to climate change; risks related to uninsured losses; the risk that consumer, travel, shopping and spending habits may change; risks associated with our Canadian investments; risks associated with attracting and retaining key personnel; risks associated with debt financing; risks associated with our guarantees of debt for, or other support we may provide to, joint venture properties; the effectiveness of our interest rate hedging arrangements; our potential failure to qualify as a Real Estate Investment Trust (“REIT”); our legal obligation to pay dividends to our shareholders; legislative or regulatory actions that could adversely affect our shareholders; our dependence on distributions from Tanger Properties Limited Partnership’s (together with its subsidiaries, the “Operating Partnership”) to meet our financial obligations, including dividends; risks of costs and disruptions from cyber-attacks or acts of cyber-terrorism on our information systems or on third party systems that we use; unanticipated threats to our business from changes in information and other technologies, including artificial intelligence; and the uncertainties of costs to comply with regulatory changes and other important factors which may cause actual results to differ materially from current expectations include, but are not limited to, those set forth under Item 1A - “Risk Factors” in the Company’s and Operating Partnership’s Annual Reports on Form 10-K for the year ended December 31, 2024 and for the year ended December 31, 2025, when available, and in other reports that we file with the SEC.
Except as required by applicable law, we do not plan to publicly update or revise any forward-looking statements contained herein, whether as a result of any new information, future events, changed circumstances or otherwise.
Investor Contact Information | Media Contact Information | |||||||||||||
Doug McDonald | ICR | |||||||||||||
SVP, Treasurer and Investments | tangerpr@icrinc.com | |||||||||||||
336-856-6066 | ||||||||||||||
tangerir@tanger.com | ||||||||||||||
v
TANGER INC. AND SUBSIDIARIES
CONSOLIDATED STATEMENTS OF OPERATIONS
(in thousands, except per share data)
(Unaudited)
| Three months ended | Year ended | ||||||||||||||||||||||
| December 31, | December 31, | ||||||||||||||||||||||
| 2025 | 2024 | 2025 | 2024 | ||||||||||||||||||||
| Revenues: | |||||||||||||||||||||||
| Rental revenue | $150,951 | $132,167 | $550,896 | $497,516 | |||||||||||||||||||
| Management, leasing and other services | 2,620 | 2,550 | 9,772 | 9,645 | |||||||||||||||||||
| Other revenue | 6,726 | 6,018 | 20,894 | 18,902 | |||||||||||||||||||
| Total revenues | 160,297 | 140,735 | 581,562 | 526,063 | |||||||||||||||||||
| Expenses: | |||||||||||||||||||||||
| Property operating | 50,500 | 45,468 | 176,502 | 158,729 | |||||||||||||||||||
General and administrative (1) | 22,123 | 21,502 | 78,722 | 78,020 | |||||||||||||||||||
| Impairment charge | — | — | 4,249 | — | |||||||||||||||||||
| Depreciation and amortization | 40,119 | 35,280 | 150,976 | 138,690 | |||||||||||||||||||
| Total expenses | 112,742 | 102,250 | 410,449 | 375,439 | |||||||||||||||||||
| Other income (expense): | |||||||||||||||||||||||
| Interest expense | (17,250) | (15,091) | (65,860) | (60,637) | |||||||||||||||||||
| Other income (expense) | 593 | 729 | 668 | 1,484 | |||||||||||||||||||
| Total other income (expense) | (16,657) | (14,362) | (65,192) | (59,153) | |||||||||||||||||||
| Income before equity in earnings of unconsolidated joint ventures | 30,898 | 24,123 | 105,921 | 91,471 | |||||||||||||||||||
| Equity in earnings of unconsolidated joint ventures | 3,926 | 3,486 | 13,580 | 11,289 | |||||||||||||||||||
| Net income | 34,824 | 27,609 | 119,501 | 102,760 | |||||||||||||||||||
| Noncontrolling interests in Operating Partnership | (1,362) | (1,123) | (4,725) | (4,245) | |||||||||||||||||||
| Noncontrolling interests in other consolidated partnerships | — | — | — | 80 | |||||||||||||||||||
| Net income attributable to Tanger Inc. | 33,462 | 26,486 | 114,776 | 98,595 | |||||||||||||||||||
| Allocation of earnings to participating securities | (221) | (228) | (872) | (920) | |||||||||||||||||||
| Net income available to common shareholders of Tanger Inc. | $33,241 | $26,258 | $113,904 | $97,675 | |||||||||||||||||||
| Basic earnings per common share: | |||||||||||||||||||||||
| Net income | $0.29 | $0.24 | $1.01 | $0.89 | |||||||||||||||||||
| Diluted earnings per common share: | |||||||||||||||||||||||
| Net income | $0.29 | $0.23 | $0.99 | $0.88 | |||||||||||||||||||
(1)The year ended December 31, 2024 includes $1.6 million of executive severance costs.
vi
TANGER INC. AND SUBSIDIARIES
CONSOLIDATED BALANCE SHEETS
(in thousands, except share data)
(Unaudited)
| December 31, | December 31, | ||||||||||
| 2025 | 2024 | ||||||||||
| Assets | |||||||||||
| Rental property: | |||||||||||
| Land | $342,203 | $311,355 | |||||||||
| Buildings, improvements and fixtures | 3,360,308 | 3,089,239 | |||||||||
| Construction in progress | 18,174 | 7,453 | |||||||||
| 3,720,685 | 3,408,047 | ||||||||||
| Accumulated depreciation | (1,513,594) | (1,428,017) | |||||||||
| Total rental property, net | 2,207,091 | 1,980,030 | |||||||||
| Cash and cash equivalents | 18,133 | 46,992 | |||||||||
| Restricted cash | 35,395 | — | |||||||||
| Investments in unconsolidated joint ventures | 64,862 | 65,665 | |||||||||
| Deferred lease costs and other intangibles, net | 110,669 | 85,028 | |||||||||
| Operating lease right-of-use assets | 83,497 | 76,099 | |||||||||
| Prepaids and other assets | 136,335 | 127,369 | |||||||||
| Total assets | $2,655,982 | $2,381,183 | |||||||||
| Liabilities and Equity | |||||||||||
| Liabilities | |||||||||||
| Debt: | |||||||||||
| Senior, unsecured notes, net | $1,043,609 | $1,041,710 | |||||||||
| Unsecured term loan, net | 323,978 | 323,182 | |||||||||
| Mortgages payable, net | 185,234 | 58,867 | |||||||||
| Unsecured lines of credit | 44,000 | — | |||||||||
| Total debt | 1,596,821 | 1,423,759 | |||||||||
| Accounts payable and accrued expenses | 133,065 | 107,775 | |||||||||
| Operating lease liabilities | 91,569 | 84,499 | |||||||||
| Other liabilities | 99,423 | 85,476 | |||||||||
| Total liabilities | 1,920,878 | 1,701,509 | |||||||||
| Commitments and contingencies | |||||||||||
| Equity | |||||||||||
| Tanger Inc.: | |||||||||||
Common shares, $0.01 par value, 300,000,000 shares authorized, 115,097,359 and 112,738,633 shares issued and outstanding at December 31, 2025 and December 31, 2024, respectively | 1,151 | 1,127 | |||||||||
| Paid in capital | 1,262,920 | 1,190,746 | |||||||||
| Accumulated distributions in excess of net income | (529,239) | (511,816) | |||||||||
| Accumulated other comprehensive loss | (28,349) | (27,687) | |||||||||
| Equity attributable to Tanger Inc. | 706,483 | 652,370 | |||||||||
| Equity attributable to noncontrolling interests: | |||||||||||
| Noncontrolling interests in Operating Partnership | 28,621 | 27,304 | |||||||||
| Noncontrolling interests in other consolidated partnerships | — | — | |||||||||
| Total equity | 735,104 | 679,674 | |||||||||
| Total liabilities and equity | $2,655,982 | $2,381,183 | |||||||||
vii
TANGER INC. AND SUBSIDIARIES
CENTER INFORMATION
(Unaudited)
| December 31, | ||||||||||||||
| 2025 | 2024 | |||||||||||||
| Gross Leasable Area Open at End of Period (in thousands): | ||||||||||||||
| Consolidated | 14,009 | 12,959 | ||||||||||||
| Unconsolidated | 2,113 | 2,113 | ||||||||||||
| Pro rata share of unconsolidated | 1,056 | 1,056 | ||||||||||||
| Managed | 457 | 758 | ||||||||||||
Total Owned and/or Managed Properties (1) | 16,579 | 15,830 | ||||||||||||
Total Owned Properties including pro rata share of unconsolidated JVs (1) | 15,065 | 14,016 | ||||||||||||
| Centers in Operation at End of Period: | ||||||||||||||
| Consolidated | 34 | 33 | ||||||||||||
| Unconsolidated | 6 | 6 | ||||||||||||
| Managed | 1 | 2 | ||||||||||||
| Total Owned and/or Managed Properties | 41 | 41 | ||||||||||||
| Ending Occupancy: | ||||||||||||||
Consolidated (2) | 98.0 | % | 98.0 | % | ||||||||||
| Unconsolidated | 99.0 | % | 98.4 | % | ||||||||||
Total Owned Properties including pro rata share of unconsolidated JVs (2) | 98.1 | % | 98.0 | % | ||||||||||
Total Owned Properties including pro rata share of unconsolidated JVs - Same Center (3) | 98.2 | % | 98.1 | % | ||||||||||
Total U.S. States Operated in at End of Period (4) | 22 | 21 | ||||||||||||
(1)Amounts may not recalculate due to the effect of rounding.
(2)December 2025 occupancy includes the results of Pinecrest, and Tanger Kansas City at Legends, which were acquired during 2025, and excludes the center in Howell, Michigan that was sold in April 2025.
(3)Excludes the results of Pinecrest, and Tanger Kansas City at Legends for December 2025 and the center in Howell, Michigan for December 2024.
(4)The Company also has an ownership interest in two centers located in Ontario, Canada.
viii
TANGER INC. AND SUBSIDIARIES
RECONCILIATION OF GAAP TO NON-GAAP SUPPLEMENTAL MEASURES (1)
(in thousands, except per share)
(Unaudited)
Below is a reconciliation of Net Income to FFO and Core FFO:
| Three months ended | Year ended | |||||||||||||||||||||||||
| December 31, | December 31, | |||||||||||||||||||||||||
| 2025 | 2024 | 2025 | 2024 | |||||||||||||||||||||||
| Net income | $34,824 | $27,609 | $119,501 | $102,760 | ||||||||||||||||||||||
| Adjusted for: | ||||||||||||||||||||||||||
| Depreciation and amortization of real estate assets - consolidated | 38,862 | 34,163 | 146,060 | 134,927 | ||||||||||||||||||||||
| Depreciation and amortization of real estate assets - unconsolidated joint ventures | 2,332 | 1,884 | 9,790 | 9,334 | ||||||||||||||||||||||
Impairment charge - consolidated | — | — | 4,249 | — | ||||||||||||||||||||||
| FFO | 76,018 | 63,656 | 279,600 | 247,021 | ||||||||||||||||||||||
| FFO attributable to noncontrolling interests in other consolidated partnerships | — | — | — | 80 | ||||||||||||||||||||||
| Allocation of earnings to participating securities | (430) | (402) | (1,614) | (1,652) | ||||||||||||||||||||||
FFO available to common shareholders (2) | $75,588 | $63,254 | $277,986 | $245,449 | ||||||||||||||||||||||
| As further adjusted for: | ||||||||||||||||||||||||||
Executive departure-related adjustments (3) | — | — | — | 1,554 | ||||||||||||||||||||||
| Impact of above adjustments to the allocation of earnings to participating securities | — | — | — | (10) | ||||||||||||||||||||||
Core FFO available to common shareholders (2) | $75,588 | $63,254 | $277,986 | $246,993 | ||||||||||||||||||||||
FFO available to common shareholders per share - diluted (2) | $0.63 | $0.54 | $2.33 | $2.12 | ||||||||||||||||||||||
Core FFO available to common shareholders per share - diluted (2) | $0.63 | $0.54 | $2.33 | $2.13 | ||||||||||||||||||||||
| Weighted Average Shares: | ||||||||||||||||||||||||||
| Basic weighted average common shares | 114,607 | 111,011 | 113,172 | 109,263 | ||||||||||||||||||||||
| Effect of dilutive securities: | ||||||||||||||||||||||||||
| Equity awards | 1,592 | 1,970 | 1,555 | 1,816 | ||||||||||||||||||||||
| Diluted weighted average common shares (for earnings per share computations) | 116,199 | 112,981 | 114,727 | 111,079 | ||||||||||||||||||||||
| Exchangeable operating partnership units | 4,663 | 4,708 | 4,666 | 4,708 | ||||||||||||||||||||||
Diluted weighted average common shares (for FFO and Core FFO per share computations) (2) | 120,862 | 117,689 | 119,393 | 115,787 | ||||||||||||||||||||||
(1)Refer to Non-GAAP Definitions beginning on page xiv for definitions of the non-GAAP supplemental measures used in this release.
(2)Assumes the Class A common limited partnership units of the Operating Partnership held by the noncontrolling interests are exchanged for common shares of the Company. Each Class A common limited partnership unit is exchangeable for one of the Company’s common shares, subject to certain limitations to preserve the Company’s REIT status.
(3)For the year ended December 31, 2024, represents executive severance costs.
ix
Below is a reconciliation of FFO to FAD (1):
| Three months ended | Year ended | |||||||||||||||||||||||||
| December 31, | December 31, | |||||||||||||||||||||||||
| 2025 | 2024 | 2025 | 2024 | |||||||||||||||||||||||
| FFO available to common shareholders | $75,588 | $63,254 | $277,986 | $245,449 | ||||||||||||||||||||||
| Adjusted for: | ||||||||||||||||||||||||||
| Corporate depreciation | 1,257 | 1,116 | 4,916 | 3,762 | ||||||||||||||||||||||
| Amortization of finance costs | 934 | 887 | 3,735 | 3,496 | ||||||||||||||||||||||
| Amortization of net debt discount | (229) | 199 | 321 | 747 | ||||||||||||||||||||||
| Amortization of equity-based compensation | 3,263 | 3,009 | 12,734 | 11,989 | ||||||||||||||||||||||
| Straight-line rent adjustments | (1,341) | (246) | (3,410) | (607) | ||||||||||||||||||||||
| Market rent adjustments | (154) | 135 | (339) | 528 | ||||||||||||||||||||||
| Second generation tenant allowances and lease incentives | (8,386) | (3,580) | (20,540) | (24,437) | ||||||||||||||||||||||
| Capital improvements | (20,061) | (9,687) | (45,321) | (33,395) | ||||||||||||||||||||||
| Adjustments from unconsolidated joint ventures | (804) | (1,724) | (3,159) | (2,873) | ||||||||||||||||||||||
FAD available to common shareholders (2) | $50,067 | $53,363 | $226,923 | $204,659 | ||||||||||||||||||||||
| Dividends per share | $0.2925 | $0.275 | $1.1525 | $1.085 | ||||||||||||||||||||||
| FFO payout ratio | 46 | % | 51 | % | 49 | % | 51 | % | ||||||||||||||||||
| FAD payout ratio | 71 | % | 61 | % | 61 | % | 61 | % | ||||||||||||||||||
Diluted weighted average common shares (2) | 120,862 | 117,689 | 119,393 | 115,787 | ||||||||||||||||||||||
(1)Refer to page ix for a reconciliation of net income to FFO available to common shareholders.
(2)Assumes the Class A common limited partnership units of the Operating Partnership held by the noncontrolling interests are exchanged for common shares of the Company. Each Class A common limited partnership unit is exchangeable for one of the Company’s common shares, subject to certain limitations to preserve the Company’s REIT status.
x
Below is a reconciliation of Net Income to Portfolio NOI and Same Center NOI for the consolidated portfolio and total portfolio at pro rata share:
| Three months ended | Year ended | |||||||||||||||||||||||||
| December 31, | December 31, | |||||||||||||||||||||||||
| 2025 | 2024 | 2025 | 2024 | |||||||||||||||||||||||
| Net income | $34,824 | $27,609 | $119,501 | $102,760 | ||||||||||||||||||||||
| Adjusted to exclude: | ||||||||||||||||||||||||||
| Equity in earnings of unconsolidated joint ventures | (3,926) | (3,486) | (13,580) | (11,289) | ||||||||||||||||||||||
| Interest expense | 17,250 | 15,091 | 65,860 | 60,637 | ||||||||||||||||||||||
| Other income | (593) | (729) | (668) | (1,484) | ||||||||||||||||||||||
| Impairment charge | — | — | 4,249 | — | ||||||||||||||||||||||
| Depreciation and amortization | 40,119 | 35,280 | 150,976 | 138,690 | ||||||||||||||||||||||
| Other non-property income | (817) | (175) | (1,648) | (1,174) | ||||||||||||||||||||||
| Corporate general and administrative expenses | 22,301 | 21,785 | 78,923 | 78,341 | ||||||||||||||||||||||
Non-cash adjustments (1) | (1,492) | (118) | (3,776) | (91) | ||||||||||||||||||||||
| Lease termination fees | (297) | (21) | (1,103) | (896) | ||||||||||||||||||||||
| Portfolio NOI - Consolidated | 107,369 | 95,236 | 398,734 | 365,494 | ||||||||||||||||||||||
| Non-same center NOI - Consolidated | (8,441) | (1,413) | (22,587) | (4,278) | ||||||||||||||||||||||
Same Center NOI - Consolidated (2) | $98,928 | $93,823 | $376,147 | $361,216 | ||||||||||||||||||||||
| Portfolio NOI - Consolidated | $107,369 | $95,236 | $398,734 | $365,494 | ||||||||||||||||||||||
Pro rata share of unconsolidated joint ventures (3) | 8,326 | 7,723 | 31,529 | 29,549 | ||||||||||||||||||||||
Portfolio NOI - Total portfolio at pro rata share (3) | 115,695 | 102,959 | 430,263 | 395,043 | ||||||||||||||||||||||
Non-same center NOI - Total portfolio at pro rata share (3) | (8,441) | (1,413) | (22,587) | (4,278) | ||||||||||||||||||||||
Same Center NOI - Total portfolio at pro rata share (2) (3) | $107,254 | $101,546 | $407,676 | $390,765 | ||||||||||||||||||||||
(1)Non-cash items include straight-line rent, above and below market rent amortization, straight-line rent expense on land leases, and gains or losses on outparcel sales, as applicable.
(2)Centers excluded from Same Center NOI:
| Little Rock | December 2024 | Acquired | Consolidated | ||||||||
| Cleveland | February 2025 | Acquired | Consolidated | ||||||||
| Kansas City | September 2025 | Acquired | Consolidated | ||||||||
| Howell | April 2025 | Sold | Consolidated | ||||||||
(3)Pro rata share metrics are presented on a constant currency basis. Constant currency is a non-GAAP measure, calculated by applying the average foreign exchange rate for the current period to all periods presented.
xi
Below are reconciliations of Net Income to Adjusted EBITDA and Adjusted EBITDAre:
| Three months ended | Year ended | |||||||||||||||||||||||||
| December 31, | December 31, | |||||||||||||||||||||||||
| 2025 | 2024 | 2025 | 2024 | |||||||||||||||||||||||
| Net income | $34,824 | $27,609 | $119,501 | $102,760 | ||||||||||||||||||||||
| Adjusted to exclude: | ||||||||||||||||||||||||||
| Interest expense, net | 16,924 | 14,306 | 65,060 | 59,414 | ||||||||||||||||||||||
| Income tax expense (benefit) | 48 | 293 | 567 | 45 | ||||||||||||||||||||||
| Depreciation and amortization | 40,119 | 35,280 | 150,976 | 138,690 | ||||||||||||||||||||||
Impairment charges - consolidated | — | — | 4,249 | — | ||||||||||||||||||||||
Executive departure-related adjustments (1) | — | — | — | 1,554 | ||||||||||||||||||||||
| Adjusted EBITDA | $91,915 | $77,488 | $340,353 | $302,463 | ||||||||||||||||||||||
| Three months ended | Year ended | |||||||||||||||||||||||||
| December 31, | December 31, | |||||||||||||||||||||||||
| 2025 | 2024 | 2025 | 2024 | |||||||||||||||||||||||
| Net income | $34,824 | $27,609 | $119,501 | $102,760 | ||||||||||||||||||||||
| Adjusted to exclude: | ||||||||||||||||||||||||||
| Interest expense, net | 16,924 | 14,306 | 65,060 | 59,414 | ||||||||||||||||||||||
| Income tax expense (benefit) | 48 | 293 | 567 | 45 | ||||||||||||||||||||||
| Depreciation and amortization | 40,119 | 35,280 | 150,976 | 138,690 | ||||||||||||||||||||||
| Impairment charges - consolidated | — | — | 4,249 | — | ||||||||||||||||||||||
| Pro rata share of interest expense, net - unconsolidated joint ventures | 1,963 | 2,186 | 8,477 | 8,725 | ||||||||||||||||||||||
Pro rata share of depreciation and amortization - unconsolidated joint ventures | 2,332 | 1,884 | 9,790 | 9,334 | ||||||||||||||||||||||
| EBITDAre | $96,210 | $81,558 | $358,620 | $318,968 | ||||||||||||||||||||||
Executive departure-related adjustments (1) | — | — | — | 1,554 | ||||||||||||||||||||||
| Adjusted EBITDAre | $96,210 | $81,558 | $358,620 | $320,522 | ||||||||||||||||||||||
(1)For the year ended December 31, 2024, represents executive severance costs.
xii
Below is a reconciliation of Total debt to Net debt for the consolidated portfolio and total portfolio at pro rata share:
| December 31, 2025 | ||||||||||||||||||||
| Consolidated | Pro Rata Share of Unconsolidated JVs | Total at Pro Rata Share | ||||||||||||||||||
| Total debt | $1,596,821 | $157,873 | $1,754,694 | |||||||||||||||||
| Less: | ||||||||||||||||||||
| Cash and cash equivalents | (18,133) | (9,685) | (27,818) | |||||||||||||||||
| Restricted cash | (35,395) | — | (35,395) | |||||||||||||||||
| Total cash and cash equivalents and restricted cash | (53,528) | (9,685) | (63,213) | |||||||||||||||||
| Net debt | $1,543,293 | $148,188 | $1,691,481 | |||||||||||||||||
| December 31, 2024 | ||||||||||||||||||||
| Consolidated | Pro Rata Share of Unconsolidated JVs | Total at Pro Rata Share | ||||||||||||||||||
| Total debt | $1,423,759 | $158,596 | $1,582,355 | |||||||||||||||||
| Less: | ||||||||||||||||||||
| Cash and cash equivalents | (46,992) | (8,740) | (55,732) | |||||||||||||||||
| Net debt | $1,376,767 | $149,856 | $1,526,623 | |||||||||||||||||
xiii
NON-GAAP DEFINITIONS
Funds From Operations
Funds From Operations (“FFO”) is a widely used measure of the operating performance for real estate companies that supplements net income (loss) determined in accordance with generally accepted accounting principles in the United States (“GAAP”). We determine FFO based on the definition set forth by the National Association of Real Estate Investment Trusts (“Nareit”), of which we are a member. In December 2018, Nareit issued “Nareit Funds From Operations White Paper - 2018 Restatement,” which clarifies, where necessary, existing guidance and consolidates alerts and policy bulletins into a single document for ease of use. Nareit defines FFO as net income (loss) available to the Company’s common shareholders computed in accordance with GAAP, excluding (i) depreciation and amortization related to real estate, (ii) gains or losses from sales of certain real estate assets, (iii) gains and losses from change in control, (iv) impairment write-downs of certain real estate assets and investments in entities when the impairment is directly attributable to decreases in the value of depreciable real estate held by the entity and (v) after adjustments for unconsolidated partnerships and joint ventures calculated to reflect FFO on the same basis.
FFO is intended to exclude historical cost depreciation of real estate as required by GAAP, which assumes that the value of real estate assets diminishes ratably over time. Historically, however, real estate values have risen or fallen with market conditions. Because FFO excludes depreciation and amortization of real estate assets, gains and losses from property dispositions and extraordinary items, it provides a performance measure that, when compared year over year, reflects the impact to operations from trends in occupancy rates, rental rates, operating costs, development activities and interest costs, providing perspective not immediately apparent from net income (loss).
We present FFO because we consider it an important supplemental measure of our operating performance. In addition, a portion of cash bonus compensation to certain members of management is based on our FFO or Core FFO, which is described in the section below. We believe it is useful for investors to have enhanced transparency into how we evaluate our performance and that of our management. In addition, FFO is frequently used by securities analysts, investors and other interested parties in the evaluation of REITs, many of which present FFO when reporting their results. FFO is also widely used by us and others in our industry to evaluate and price potential acquisition candidates. We believe that FFO payout ratio, which represents regular distributions to common shareholders and unitholders of the Operating Partnership expressed as a percentage of FFO, is useful to investors because it facilitates the comparison of dividend coverage between REITs. Nareit has encouraged its member companies to report their FFO as a supplemental, industry-wide standard measure of REIT operating performance.
FFO has significant limitations as an analytical tool, and you should not consider it in isolation, or as a substitute for analysis of our results as reported under GAAP. Some of these limitations are:
•FFO does not reflect our cash expenditures, or future requirements, for capital expenditures or contractual commitments;
•FFO does not reflect changes in, or cash requirements for, our working capital needs;
•Although depreciation and amortization are non-cash charges, the assets being depreciated and amortized will often have to be replaced in the future, and FFO does not reflect any cash requirements for such replacements; and
•Other companies in our industry may calculate FFO differently than we do, limiting its usefulness as a comparative measure.
Because of these limitations, FFO should not be considered as a measure of discretionary cash available to us to invest in the growth of our business or our dividend paying capacity. We compensate for these limitations by relying primarily on our GAAP results and using FFO only as a supplemental measure.
Core FFO
We present Core Funds From Operations (“Core FFO”) as a supplemental measure of our performance. We define Core FFO as FFO further adjusted to eliminate the impact of certain items that we do not consider indicative of our ongoing operating performance. These further adjustments are itemized in the table above. You are encouraged to evaluate these adjustments and the reasons we consider them appropriate for supplemental analysis. In evaluating Core FFO you should be aware that in the future we may incur expenses that are the same as or similar to some of the adjustments in this presentation. Our presentation of Core FFO should not be construed as an inference that our future results will be unaffected by unusual or non-recurring items.
We present Core FFO because we believe it assists investors and analysts in comparing our performance across reporting periods on a consistent basis by excluding items that we do not believe are indicative of our core operating performance. In addition, we believe it is useful for investors to have enhanced transparency into how we evaluate management’s performance and the effectiveness of our business strategies. We use Core FFO when certain material, unplanned transactions occur as a
xiv
factor in evaluating management’s performance and to evaluate the effectiveness of our business strategies, and may use Core FFO when determining incentive compensation.
Core FFO has limitations as an analytical tool. Some of these limitations are:
•Core FFO does not reflect our cash expenditures, or future requirements, for capital expenditures or contractual commitments;
•Core FFO does not reflect changes in, or cash requirements for, our working capital needs;
•Although depreciation and amortization are non-cash charges, the assets being depreciated and amortized will often have to be replaced in the future, and Core FFO does not reflect any cash requirements for such replacements;
•Core FFO does not reflect the impact of certain cash charges resulting from matters we consider not to be indicative of our ongoing operations; and
•Other companies in our industry may calculate Core FFO differently than we do, limiting its usefulness as a comparative measure.
Because of these limitations, Core FFO should not be considered in isolation or as a substitute for performance measures calculated in accordance with GAAP. We compensate for these limitations by relying primarily on our GAAP results and using Core FFO only as a supplemental measure.
Funds Available for Distribution
Funds Available for Distribution (“FAD”) is a non-GAAP financial measure that we define as FFO (defined as net income (loss) available to the Company’s common shareholders computed in accordance with GAAP, excluding (i) depreciation and amortization related to real estate, (ii) gains or losses from sales of certain real estate assets, (iii) gains and losses from change in control, (iv) impairment write-downs of certain real estate assets and investments in entities when the impairment is directly attributable to decreases in the value of depreciable real estate held by the entity and (v) after adjustments for unconsolidated partnerships and joint ventures calculated to reflect FFO on the same basis), excluding corporate depreciation, amortization of finance costs, amortization of net debt discount (premium), amortization of equity-based compensation, straight-line rent amounts, market rent amounts, second generation tenant allowances and lease incentives, recurring capital improvement expenditures, and our share of the items listed above for our unconsolidated joint ventures. Investors, analysts and the Company utilize FAD as an indicator of common dividend potential. The FAD payout ratio, which represents regular distributions to common shareholders and unitholders of the Operating Partnership expressed as a percentage of FAD, facilitates the comparison of dividend coverage between REITs.
We believe that net income (loss) is the most directly comparable GAAP financial measure to FAD. FAD does not represent cash generated from operating activities in accordance with GAAP and should not be considered as an alternative to net income (loss) as an indication of our performance or to cash flows as a measure of liquidity or our ability to make distributions. Other companies in our industry may calculate FAD differently than we do, limiting its usefulness as a comparative measure.
Portfolio Net Operating Income and Same Center Net Operating Income
We present portfolio net operating income (“Portfolio NOI”) and same center net operating income (“Same Center NOI”) as supplemental measures of our operating performance. Portfolio NOI represents our property level net operating income, which is defined as total operating revenues less property operating expenses and excludes termination fees and non-cash adjustments including straight-line rent, net above and below market rent amortization, impairment charges, loss on early extinguishment of debt and gains or losses on the sale of assets recognized during the periods presented. We define Same Center NOI as Portfolio NOI for the properties that were operational for the entire portion of both comparable reporting periods and which were not acquired, or subject to a material expansion or non-recurring event, such as a natural disaster, during the comparable reporting periods. We present Portfolio NOI and Same Center NOI on both a consolidated and total portfolio, including pro rata share of unconsolidated joint ventures, basis.
We believe Portfolio NOI and Same Center NOI are non-GAAP metrics used by industry analysts, investors and management to measure the operating performance of our properties because they provide performance measures directly related to the revenues and expenses involved in owning and operating real estate assets and provide a perspective not immediately apparent from net income (loss), FFO or Core FFO. Because Same Center NOI excludes properties developed, redeveloped, acquired and sold; as well as non-cash adjustments, gains or losses on the sale of outparcels and termination rents; it highlights operating trends such as occupancy levels, rental rates and operating costs on properties that were operational for both comparable periods. Portfolio NOI and Same Center NOI should not be considered alternatives to net income (loss) as an indication of our performance or to cash flows as a measure of our liquidity or our ability to make distributions. Other REITs may use different methodologies for calculating Portfolio NOI and Same Center NOI, and accordingly, our Portfolio NOI and Same Center NOI may not be comparable to other REITs.
xv
Portfolio NOI and Same Center NOI should not be considered alternatives to net income (loss) or as an indicator of our financial performance since they do not reflect the entire operations of our portfolio, nor do they reflect the impact of general and administrative expenses, acquisition-related expenses, interest expense, depreciation and amortization costs, other non-property income and losses, the level of capital expenditures and leasing costs necessary to maintain the operating performance of our properties, or trends in development and construction activities which are significant economic costs and activities that could materially impact our results from operations. Because of these limitations, Portfolio NOI and Same Center NOI should not be viewed in isolation or as a substitute for performance measures calculated in accordance with GAAP. We compensate for these limitations by relying primarily on our GAAP results and using Portfolio NOI and Same Center NOI only as supplemental measures.
Adjusted EBITDA, EBITDAre and Adjusted EBITDAre
We present Earnings Before Interest, Taxes, Depreciation and Amortization (“EBITDA”) as adjusted for items described below (“Adjusted EBITDA”), EBITDA for Real Estate (“EBITDAre”) and Adjusted EBITDAre, all non-GAAP measures, as supplemental measures of our operating performance. Each of these measures is defined as follows:
We define Adjusted EBITDA as net income (loss) available to the Company’s common shareholders computed in accordance with GAAP before net interest expense, income taxes (if applicable), depreciation and amortization, gains and losses on sale of operating properties, joint venture properties, outparcels and other assets, impairment write-downs of depreciated property and of investment in unconsolidated joint ventures caused by a decrease in value of depreciated property in the affiliate, compensation related to voluntary retirement plan and other executive officer severance, certain executive departure-related adjustments, gain on sale of non-real estate asset adjustments, casualty gains and losses, gains and losses on early extinguishment of debt, net and other items that we do not consider indicative of the Company’s ongoing operating performance.
We determine EBITDAre based on the definition set forth by Nareit, which is defined as net income (loss) available to the Company’s common shareholders computed in accordance with GAAP before net interest expense, income taxes (if applicable), depreciation and amortization, gains and losses on sale of operating properties, gains and losses on change of control and impairment write-downs of depreciated property and of investment in unconsolidated joint ventures caused by a decrease in value of depreciated property in the affiliate and after adjustments to reflect our share of the EBITDAre of unconsolidated joint ventures.
Adjusted EBITDAre is defined as EBITDAre excluding gains and losses on early extinguishment of debt, net, casualty gains and losses, compensation related to voluntary retirement plan and other executive officer severance, gain on sale of non-real estate asset adjustments, gains and losses on sale of outparcels, and other items that we do not consider indicative of the Company’s ongoing operating performance.
We present Adjusted EBITDA, EBITDAre and Adjusted EBITDAre as we believe they are useful for investors, creditors and rating agencies as they provide additional performance measures that are independent of a Company’s existing capital structure to facilitate the evaluation and comparison of the Company’s operating performance to other REITs and provide a more consistent metric for comparing the operating performance of the Company’s real estate between periods.
Adjusted EBITDA, EBITDAre and Adjusted EBITDAre have significant limitations as analytical tools, including:
•They do not reflect our net interest expense;
•They do not reflect gains or losses on sales of operating properties or impairment write-downs of depreciated property and of investment in unconsolidated joint ventures caused by a decrease in value of depreciated property in the affiliate;
•Adjusted EBITDA and Adjusted EBITDAre do not reflect gains and losses on extinguishment of debt and other items that may affect operations; and
•Other companies in our industry may calculate these measures differently than we do, limiting its usefulness as a comparative measure.
Because of these limitations, Adjusted EBITDA, EBITDAre and Adjusted EBITDAre should not be considered in isolation or as a substitute for performance measures calculated in accordance with GAAP. We compensate for these limitations by relying primarily on our GAAP results and using Adjusted EBITDA, EBITDAre and Adjusted EBITDAre only as supplemental measures.
Net Debt
We define Net debt as total debt less cash and cash equivalents, including restricted cash, and short-term investments and present this metric for both the consolidated portfolio and for the total portfolio, including the consolidated portfolio and the Company’s pro rata share of unconsolidated joint ventures. Net debt is a component of the Net debt to Adjusted EBITDA ratio, which is defined as Net debt for the respective portfolio divided by Adjusted EBITDA (consolidated portfolio) or Adjusted EBITDAre (total portfolio at pro rata share). We use the Net debt to Adjusted EBITDA and the Net debt to Adjusted EBITDAre ratios to evaluate the Company’s leverage. We believe this measure is an important indicator of the Company’s ability to service its long-term debt obligations.
xvi
Supplemental Operating and Financial Data for the
Quarter and Year Ended December 31, 2025
Notice
For a more detailed discussion of the factors that affect our operating results, interested parties should review the Company’s and Operating Partnership’s Annual Reports on Form 10-K for the year ended December 31, 2024 and for the year ended December 31, 2025, when available.
This Supplemental Operating and Financial Data is not an offer to sell or a solicitation to buy any securities of the Company or the Operating Partnership. Any offers to sell or solicitations to buy any securities of the Company or the Operating Partnership shall be made only by means of a prospectus.
Safe Harbor Statement
Certain statements made in this supplement contain forward-looking statements within the meaning of Section 27A of the Securities Act of 1933, as amended, and Section 21E of the Securities Exchange Act of 1934, as amended. We intend such forward-looking statements to be covered by the safe harbor provisions for forward-looking statements contained in the Private Securities Litigation Reform Act of 1995 and include this statement for purposes of complying with these safe harbor provisions. Forward-looking statements are generally identifiable by use of the words “anticipate,” “believe,” “can,” “continue,” “could,” “designed,” “estimate,” “expect,” “forecast,” “goal,” “intend,” “may,” “might,” “plan,” “possible,” “potential,” “predict,” “project,” “should,” “target,” “will,” “would,” and similar expressions that do not report historical matters. Such statements are based on assumptions and expectations that may not be realized and are inherently subject to risks, uncertainties and other factors, many of which cannot be predicted with accuracy and some of which might not even be anticipated. Although we believe the expectations reflected in these forward-looking statements are based on reasonable assumptions, future events and actual results, performance, transactions or achievements, financial and otherwise, may differ materially from the results, performance, transactions or achievements expressed or implied by the forward-looking statements. As a result, you should not rely on or construe any forward-looking statements in this supplement as predictions of future events or as guarantees of future performance. We caution you not to place undue reliance on forward-looking statements, which speak only as of the date of this supplement. All of our forward-looking statements are qualified in their entirety by this statement.
There are a number of risks, uncertainties and other factors that could cause our actual results to differ materially from the forward-looking statements contained in or contemplated by this supplement. Any forward-looking statements should be considered in light of the risks, uncertainties and other factors referred to in Item 1A. “Risk Factors” in our most recent Annual Report on Form 10-K and our subsequent Quarterly Reports on Form 10-Q and in our other filings with the SEC. Such risks and uncertainties include, but are not limited to: risks associated with general economic and financial conditions, including inflationary pressures and recessionary fears; newly-imposed and potentially additional U.S. tariffs and responsive non-U.S. tariffs; increased capital costs and capital markets volatility; increases in unemployment and reduced consumer confidence and spending; risks related to our ability to develop new retail centers or expand existing retail centers successfully; risks related to the financial performance and market value of our retail centers and the potential for reductions in asset valuations and related impairment charges; our dependence on rental income from real property; the relative illiquidity of real property investments; failure of our acquisitions or dispositions of retail centers to achieve anticipated results; competition for the acquisition and development of retail centers, and our inability to complete the acquisitions of retail centers we may identify; competition for tenants with competing retail centers and our inability to execute leases with tenants on terms consistent with our expectations; the diversification of our tenant mix and our entry into the operation of full price retail may not achieve our expected results; risks associated with environmental regulations; risks associated with possible terrorist activity or other acts or threats of violence and threats to public safety; risks related to international military conflicts, international trade disputes and foreign currency volatility; the fact that certain of our leases include co-tenancy and/or sales-based provisions that may allow a tenant to pay reduced rent and/or terminate a lease prior to its natural expiration; our dependence on the results of operations of our retailers and their bankruptcy, early termination or closing could adversely affect us; the impact of geopolitical conflicts; the impact of a prolonged government shutdown; the immediate and long-term impact of the outbreak of a highly infectious or contagious disease on our tenants and on our business (including the impact of actions taken to contain the outbreak or mitigate its impact); the fact that certain of our properties are subject to ownership interests held by third parties, whose interests may conflict with ours; risks related to climate change; risks related to uninsured losses; the risk that consumer, travel, shopping and spending habits may change; risks associated with our Canadian investments; risks associated with attracting and retaining key personnel; risks associated with debt financing; risks associated with our guarantees of debt for, or other support we may provide to, joint venture properties; the effectiveness of our interest rate hedging arrangements; our potential failure to qualify as a REIT; our legal obligation to pay dividends to our shareholders; legislative or regulatory actions that could adversely affect our shareholders; our dependence on distributions from the Operating Partnership to meet our financial obligations, including dividends; risks of costs
1
Supplemental Operating and Financial Data for the
Quarter and Year Ended December 31, 2025

and disruptions from cyber-attacks or acts of cyber-terrorism on our information systems or on third party systems that we use; unanticipated threats to our business from changes in information and other technologies, including artificial intelligence; and the uncertainties of costs to comply with regulatory changes and other important factors which may cause actual results to differ materially from current expectations include, but are not limited to, those set forth under Item 1A - “Risk Factors” in the Company’s and the Operating Partnership’s Annual Reports on Form 10-K for the year ended December 31, 2024 and for the year ended December 31, 2025, when available, and in other reports that we file with the SEC.
Except as required by applicable law, we do not plan to publicly update or revise any forward-looking statements contained herein, whether as a result of any new information, future events, changed circumstances or otherwise.
2
Supplemental Operating and Financial Data for the
Quarter and Year Ended December 31, 2025
Summary Operating Metrics
| December 31, | ||||||||||||||
| 2025 | 2024 | |||||||||||||
| Centers in Operation at End of Period: | ||||||||||||||
| Consolidated | 34 | 33 | ||||||||||||
| Unconsolidated | 6 | 6 | ||||||||||||
| Managed | 1 | 2 | ||||||||||||
| Total Owned and/or Managed Properties | 41 | 41 | ||||||||||||
| Gross Leasable Area (“GLA”) Open at End of Period (in thousands): | ||||||||||||||
| Consolidated | 14,009 | 12,959 | ||||||||||||
| Unconsolidated | 2,113 | 2,113 | ||||||||||||
| Pro rata share of unconsolidated | 1,056 | 1,056 | ||||||||||||
| Managed | 457 | 758 | ||||||||||||
| Total Owned and/or Managed Properties | 16,579 | 15,830 | ||||||||||||
Total Owned Properties including pro rata share of unconsolidated JVs (1) | 15,065 | 14,016 | ||||||||||||
Ending Occupancy (2) | ||||||||||||||
| Consolidated | 98.0 | % | 98.0 | % | ||||||||||
| Unconsolidated | 99.0 | % | 98.4 | % | ||||||||||
Total Owned Properties including pro rata share of unconsolidated JVs (2) | 98.1 | % | 98.0 | % | ||||||||||
Total Owned Properties including pro rata share of unconsolidated JVs - Same Center (3) | 98.2 | % | 98.1 | % | ||||||||||
Average Tenant Sales Per Square Foot (2)(4) | ||||||||||||||
| Consolidated | $472 | $441 | ||||||||||||
| Unconsolidated | $486 | $428 | ||||||||||||
Total Owned Properties including pro rata share of unconsolidated JVs (2) | $473 | $443 | ||||||||||||
Total Owned Properties including pro rata share of unconsolidated JVs - Same Center (5) | $474 | $447 | ||||||||||||
Occupancy Cost Ratio (2)(6) | 9.7 | % | 9.5 | % | ||||||||||
(1)Amounts may not recalculate due to the effect of rounding.
(2)December 2025 occupancy, average tenant sales per square foot, and occupancy cost ratio include the results of Pinecrest and Tanger Outlets Kansas City at Legends, which were acquired during 2025, and exclude the center in Howell, Michigan that was sold in April 2025.
(3)Excludes the results of Pinecrest and Tanger Outlets Kansas City at Legends for December 2025 and the center in Howell, Michigan for December 2024.
(4)Average tenant sales per square foot is presented on a constant currency basis for the trailing twelve-month periods and include stores in stabilized centers that have been occupied a minimum of twelve months and are less than 20,000 square feet. Constant currency is a non-GAAP measure, calculated by applying the average foreign exchange rate for the current period to all periods presented.
(5)Excludes the results of Pinecrest, Tanger Outlets Kansas City at Legends, and Tanger Outlets Nashville for December 2025 and the center in Howell, Michigan for December 2024.
(6)Occupancy cost ratio represents annualized occupancy costs as of the end of the reporting period as a percentage of tenant sales for the trailing twelve-month periods for consolidated properties and the Company’s pro rata share of unconsolidated joint ventures.
3
Supplemental Operating and Financial Data for the
Quarter and Year Ended December 31, 2025
Geographic Diversification
As of December 31, 2025
Consolidated Properties
| State | # of Centers | GLA | % of GLA | ||||||||||||||
| South Carolina | 5 | 1,606,491 | 12 | % | |||||||||||||
| New York | 2 | 1,466,850 | 10 | % | |||||||||||||
| Alabama | 2 | 1,205,752 | 9 | % | |||||||||||||
| Georgia | 3 | 1,179,697 | 8 | % | |||||||||||||
| Pennsylvania | 3 | 1,000,976 | 7 | % | |||||||||||||
| Texas | 2 | 823,717 | 6 | % | |||||||||||||
| Tennessee | 2 | 740,746 | 5 | % | |||||||||||||
| North Carolina | 2 | 696,194 | 5 | % | |||||||||||||
| Kansas | 1 | 688,584 | 5 | % | |||||||||||||
| Ohio | 1 | 638,396 | 5 | % | |||||||||||||
| Delaware | 1 | 547,937 | 4 | % | |||||||||||||
| New Jersey | 1 | 484,748 | 3 | % | |||||||||||||
| Arizona | 1 | 410,753 | 3 | % | |||||||||||||
| Michigan | 1 | 357,133 | 3 | % | |||||||||||||
| Florida | 1 | 351,691 | 3 | % | |||||||||||||
| Missouri | 1 | 329,861 | 2 | % | |||||||||||||
| Mississippi | 1 | 325,831 | 2 | % | |||||||||||||
| Louisiana | 1 | 322,063 | 2 | % | |||||||||||||
| Connecticut | 1 | 311,229 | 2 | % | |||||||||||||
| Arkansas | 1 | 269,642 | 2 | % | |||||||||||||
| New Hampshire | 1 | 250,558 | 2 | % | |||||||||||||
| Total Consolidated Properties | 34 | 14,008,849 | 100 | % | |||||||||||||
| Unconsolidated Joint Venture Properties | |||||||||||||||||
| # of Centers | GLA | Ownership % | |||||||||||||||
| Ontario, Canada | 2 | 665,096 | 50 | % | |||||||||||||
| North Carolina | 1 | 398,674 | 50 | % | |||||||||||||
| Ohio | 1 | 355,245 | 50 | % | |||||||||||||
| Texas | 1 | 352,705 | 50 | % | |||||||||||||
| Maryland | 1 | 341,156 | 50 | % | |||||||||||||
| Total Unconsolidated Joint Venture Properties | 6 | 2,112,876 | |||||||||||||||
| Tanger’s Pro Rata Share of Unconsolidated Joint Venture Properties | 1,056,438 | ||||||||||||||||
| Managed Property | |||||||||||||||||
| # of Centers | GLA | ||||||||||||||||
| Palm Beach, FL | 1 | 457,326 | |||||||||||||||
| Total Owned and/or Managed Properties | 41 | 16,579,051 | |||||||||||||||
| Total Owned Properties including pro rata share of unconsolidated JVs | 40 | 15,065,287 | |||||||||||||||
4
Supplemental Operating and Financial Data for the
Quarter and Year Ended December 31, 2025
Property Summary - Occupancy at End of Each Period Shown (1)
| Property Name | Location | Total GLA 12/31/2025 | % Occupied 12/31/2025 | % Occupied 9/30/2025 | % Occupied 12/31/2024 | |||||||||||||||||||||
| Tanger Outlets Deer Park | Deer Park, NY | 737,473 | 100.0 | % | 100.0 | % | 100.0 | % | ||||||||||||||||||
| Tanger Outlets Riverhead | Riverhead, NY | 729,377 | 98.4 | % | 94.8 | % | 96.0 | % | ||||||||||||||||||
| Tanger Outlets Kansas City at Legends | Kansas City, KS | 688,584 | 96.2 | % | 93.5 | % | N/A | |||||||||||||||||||
| Bridge Street Town Centre, a Tanger Property | Huntsville, AL | 651,016 | 92.9 | % | 90.2 | % | 95.0 | % | ||||||||||||||||||
| Pinecrest, a Tanger Property | Cleveland, OH | 638,396 | 98.2 | % | 98.5 | % | N/A | |||||||||||||||||||
| Tanger Outlets Foley | Foley, AL | 554,736 | 94.0 | % | 96.9 | % | 98.7 | % | ||||||||||||||||||
| Tanger Outlets Rehoboth Beach | Rehoboth Beach, DE | 547,937 | 100.0 | % | 99.2 | % | 98.4 | % | ||||||||||||||||||
| Tanger Outlets Savannah | Savannah, GA | 487,207 | 100.0 | % | 100.0 | % | 100.0 | % | ||||||||||||||||||
| Tanger Outlets Atlantic City | Atlantic City, NJ | 484,748 | 80.7 | % | 81.5 | % | 87.7 | % | ||||||||||||||||||
| Tanger Outlets San Marcos | San Marcos, TX | 471,816 | 99.3 | % | 99.3 | % | 99.5 | % | ||||||||||||||||||
| Tanger Outlets Sevierville | Sevierville, TN | 450,079 | 100.0 | % | 97.3 | % | 100.0 | % | ||||||||||||||||||
| Tanger Outlets Myrtle Beach Hwy 501 | Myrtle Beach, SC | 426,523 | 99.0 | % | 97.6 | % | 98.7 | % | ||||||||||||||||||
| Tanger Outlets Phoenix | Glendale, AZ | 410,753 | 100.0 | % | 100.0 | % | 100.0 | % | ||||||||||||||||||
| Tanger Outlets Myrtle Beach Hwy 17 | Myrtle Beach, SC | 404,341 | 100.0 | % | 100.0 | % | 100.0 | % | ||||||||||||||||||
| Tanger Outlets Charleston | Charleston, SC | 386,328 | 100.0 | % | 100.0 | % | 99.5 | % | ||||||||||||||||||
| Tanger Outlets Lancaster | Lancaster, PA | 377,417 | 100.0 | % | 98.7 | % | 100.0 | % | ||||||||||||||||||
| Tanger Outlets Asheville | Asheville, NC | 376,432 | 97.4 | % | 97.4 | % | 98.4 | % | ||||||||||||||||||
| Tanger Outlets Pittsburgh | Pittsburgh, PA | 373,863 | 100.0 | % | 99.7 | % | 99.8 | % | ||||||||||||||||||
| Tanger Outlets Commerce | Commerce, GA | 371,408 | 100.0 | % | 100.0 | % | 99.3 | % | ||||||||||||||||||
| Tanger Outlets Grand Rapids | Grand Rapids, MI | 357,133 | 97.0 | % | 98.7 | % | 97.5 | % | ||||||||||||||||||
| Tanger Outlets Fort Worth | Fort Worth, TX | 351,901 | 100.0 | % | 99.1 | % | 100.0 | % | ||||||||||||||||||
| Tanger Outlets Daytona Beach | Daytona Beach, FL | 351,691 | 100.0 | % | 100.0 | % | 100.0 | % | ||||||||||||||||||
| Tanger Outlets Branson | Branson, MO | 329,861 | 100.0 | % | 100.0 | % | 100.0 | % | ||||||||||||||||||
| Tanger Outlets Memphis | Southaven, MS | 325,831 | 100.0 | % | 100.0 | % | 100.0 | % | ||||||||||||||||||
| Tanger Outlets Gonzales | Gonzales, LA | 322,063 | 98.9 | % | 95.8 | % | 100.0 | % | ||||||||||||||||||
| Tanger Outlets Atlanta | Locust Grove, GA | 321,082 | 100.0 | % | 100.0 | % | 99.2 | % | ||||||||||||||||||
| Tanger Outlets Mebane | Mebane, NC | 319,762 | 100.0 | % | 100.0 | % | 100.0 | % | ||||||||||||||||||
| Tanger Outlets at Foxwoods | Mashantucket, CT | 311,229 | 95.6 | % | 97.2 | % | 91.1 | % | ||||||||||||||||||
| Tanger Outlets Nashville | Nashville, TN | 290,667 | 100.0 | % | 98.2 | % | 96.7 | % | ||||||||||||||||||
| The Promenade at Chenal, a Tanger Property | Little Rock, AR | 269,642 | 98.1 | % | 97.6 | % | 91.1 | % | ||||||||||||||||||
| Tanger Outlets Tilton | Tilton, NH | 250,558 | 98.6 | % | 95.3 | % | 100.0 | % | ||||||||||||||||||
| Tanger Outlets Hershey | Hershey, PA | 249,696 | 100.0 | % | 100.0 | % | 100.0 | % | ||||||||||||||||||
| Tanger Outlets Hilton Head II | Hilton Head, SC | 206,564 | 100.0 | % | 97.1 | % | 95.1 | % | ||||||||||||||||||
| Tanger Outlets Hilton Head I | Hilton Head, SC | 182,735 | 100.0 | % | 100.0 | % | 97.1 | % | ||||||||||||||||||
| Tanger Outlets Howell | Howell, MI | N/A | N/A | N/A | 93.3 | % | ||||||||||||||||||||
| Total Consolidated | 14,008,849 | 98.0 | % | 97.4 | % | 98.0 | % | |||||||||||||||||||
| Charlotte Premium Outlets | Charlotte, NC | 398,674 | 98.6 | % | 98.9 | % | 98.2 | % | ||||||||||||||||||
| Tanger Outlets Ottawa | Ottawa, ON | 357,213 | 99.6 | % | 99.6 | % | 100.0 | % | ||||||||||||||||||
| Tanger Outlets Columbus | Columbus, OH | 355,245 | 100.0 | % | 99.7 | % | 100.0 | % | ||||||||||||||||||
| Tanger Outlets Houston | Texas City, TX | 352,705 | 99.0 | % | 94.7 | % | 99.2 | % | ||||||||||||||||||
| Tanger Outlets National Harbor | National Harbor, MD | 341,156 | 100.0 | % | 100.0 | % | 98.9 | % | ||||||||||||||||||
| Tanger Outlets Cookstown | Cookstown, ON | 307,883 | 96.8 | % | 96.7 | % | 93.8 | % | ||||||||||||||||||
| Total Unconsolidated | 2,112,876 | 99.0 | % | 98.3 | % | 98.4 | % | |||||||||||||||||||
| Tanger’s pro rata share of unconsolidated JVs | 1,056,438 | 99.0 | % | 98.3 | % | 98.4 | % | |||||||||||||||||||
| Total Owned Properties including pro rata share of unconsolidated JVs | 15,065,287 | 98.1 | % | 97.4 | % | 98.0 | % | |||||||||||||||||||
Total Owned Properties including pro rata share of unconsolidated JVs - Same Center (2) | 13,738,307 | 98.2 | % | 97.6 | % | 98.1 | % | |||||||||||||||||||
(1)Excludes square footage and occupancy associated with ground leases to tenants.
(2)Excludes GLA and occupancy rates at Pinecrest, Tanger Outlets Kansas City at Legends, and the center in Howell, Michigan for all periods.
5
Supplemental Operating and Financial Data for the
Quarter and Year Ended December 31, 2025
Portfolio Map as of December 31, 2025
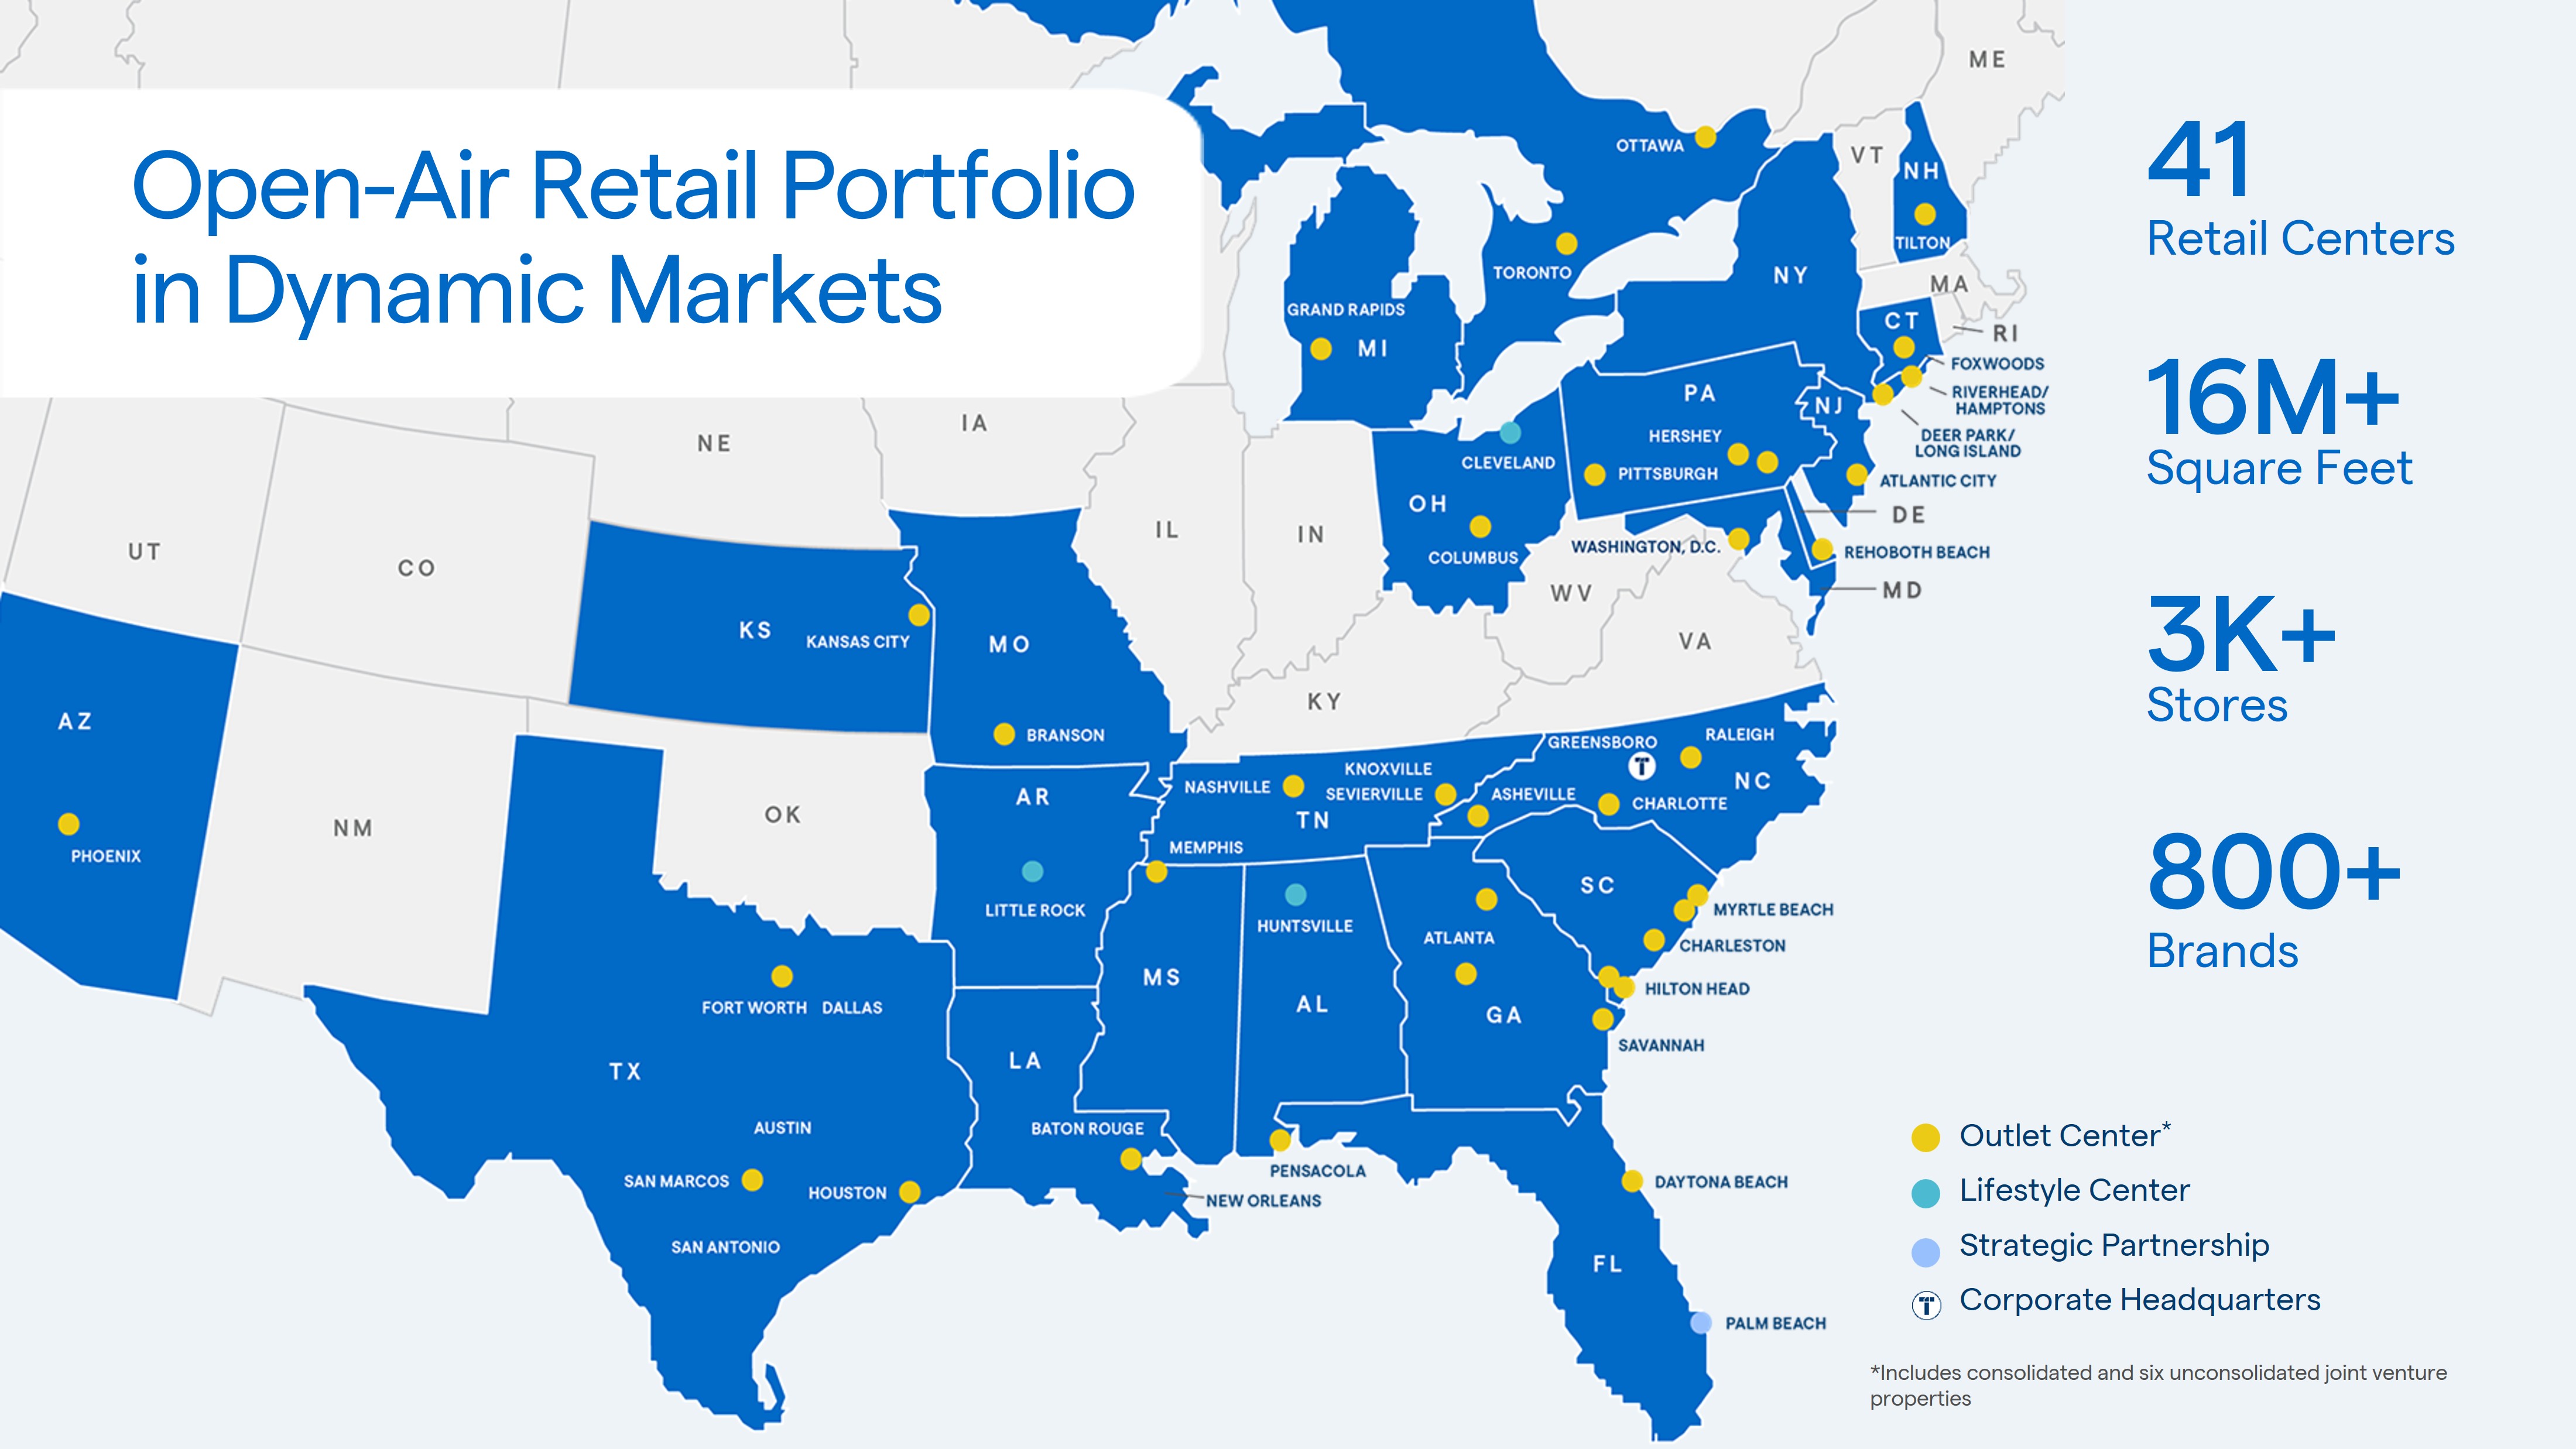
Portfolio Occupancy at the End of Each Period (1)
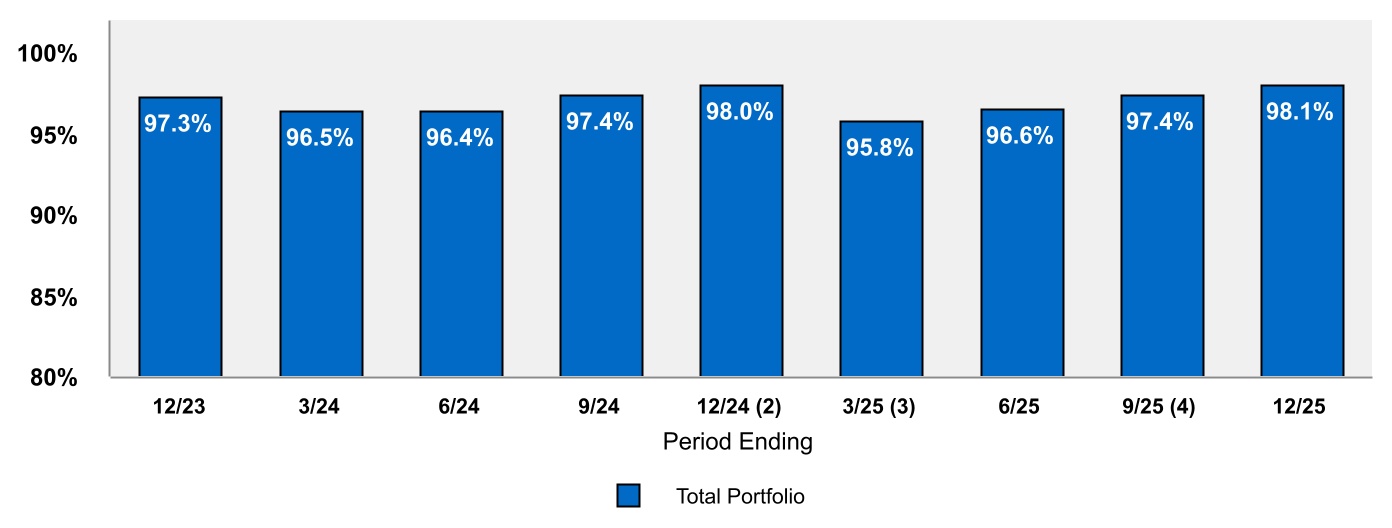
(1) Includes the Company’s pro rata share of unconsolidated joint ventures.
(2) Beginning in December 2024, total portfolio occupancy includes the occupancy rate at The Promenade at Chenal, which was acquired during the fourth quarter of 2024.
(3) Beginning in March 2025, total portfolio occupancy includes the occupancy rate at Pinecrest, which was acquired during the first quarter of 2025, and excludes the occupancy rate at the center in Howell, Michigan that was sold in April 2025.
(4) Beginning in September 2025, total portfolio occupancy includes the occupancy rate at Tanger Outlets Kansas City at Legends, which was acquired during the third quarter of 2025.
6
Supplemental Operating and Financial Data for the
Quarter and Year Ended December 31, 2025
Center Sales Per Square Foot Ranking (“SPSF”) as of December 31, 2025 (1)
Ranking (2) | 12 Months SPSF | Period End Occupancy | GLA (thousands) | % of GLA | % of Portfolio NOI (3) | ||||||||||||||||||
| Consolidated Centers | |||||||||||||||||||||||
| Centers 1 - 5 | $679 | 98.0 | % | 2,520 | 17 | % | 22 | % | |||||||||||||||
| Centers 6 - 10 | $546 | 99.5 | % | 2,272 | 15 | % | 18 | % | |||||||||||||||
| Centers 11 - 16 | $485 | 100.0 | % | 1,837 | 12 | % | 14 | % | |||||||||||||||
| Centers 17 - 22 | $440 | 98.7 | % | 2,873 | 19 | % | 18 | % | |||||||||||||||
| Centers 23 - 28 | $371 | 97.4 | % | 2,393 | 16 | % | 13 | % | |||||||||||||||
| Centers 29 - 34 | $327 | 94.6 | % | 2,114 | 14 | % | 8 | % | |||||||||||||||
Ranking (2) | Cumulative 12 Months SPSF | Cumulative Period End Occupancy | Cumulative GLA (thousands) | Cumulative % of GLA | Cumulative % of Portfolio NOI (3) | ||||||||||||||||||
| Consolidated Centers | |||||||||||||||||||||||
| Centers 1 - 5 | $679 | 98.0 | % | 2,520 | 17 | % | 22 | % | |||||||||||||||
| Centers 1 - 10 | $614 | 98.7 | % | 4,792 | 32 | % | 40 | % | |||||||||||||||
| Centers 1 - 16 | $571 | 99.1 | % | 6,629 | 44 | % | 54 | % | |||||||||||||||
| Centers 1 - 22 | $531 | 98.9 | % | 9,502 | 63 | % | 72 | % | |||||||||||||||
| Centers 1 - 28 | $499 | 98.6 | % | 11,895 | 79 | % | 85 | % | |||||||||||||||
| Centers 1 - 34 | $472 | 98.0 | % | 14,009 | 93 | % | 93 | % | |||||||||||||||
Unconsolidated Centers at Pro Rata Share (4) | $486 | 99.0 | % | 1,056 | 7 | % | 7 | % | |||||||||||||||
Total Centers at Pro Rata Share (5) | $473 | 98.1 | % | 15,065 | 100 | % | 100 | % | |||||||||||||||
| (1) | Centers are ranked by sales per square foot for the trailing twelve months ended December 31, 2025, and sales per square foot include stores that have been occupied for a minimum of twelve months and are less than 20,000 square feet. | ||||||||||||||||||||||
| (2) | Centers included in each ranking group above are as follows (in alphabetical order): | ||||||||||||||||||||||
| Centers 1 - 5: | Deer Park, NY | Glendale, AZ (Phoenix) | Huntsville, AL (Bridge Street Town Centre) | Little Rock, AR (The Promenade at Chenal) | Sevierville, TN | ||||||||||||||||||
| Centers 6 - 10: | Branson, MO | Cleveland, OH (Pinecrest) | Fort Worth, TX | Myrtle Beach Hwy 17, SC | Rehoboth Beach, DE | ||||||||||||||||||
| Centers 11 - 16: | Charleston, SC | Hershey, PA | Hilton Head I, SC | Lancaster, PA | Locust Grove, GA | Mebane, NC | |||||||||||||||||
| Centers 17 - 22: | Daytona Beach, FL | Kansas City, KS | Nashville, TN | Riverhead, NY | Savannah, GA | Southaven, MS (Memphis) | |||||||||||||||||
| Centers 23 - 28: | Asheville, NC | Foley, AL | Grand Rapids, MI | Hilton Head II, SC | Myrtle Beach Hwy 501, SC | San Marcos, TX | |||||||||||||||||
| Centers 29 - 34: | Atlantic City, NJ | Commerce, GA | Gonzales, LA | Mashantucket, CT (Foxwoods) | Pittsburgh, PA | Tilton, NH | |||||||||||||||||
| (3) | Based on the Company’s forecast of 2026 Portfolio NOI (Portfolio NOI is a non-GAAP measure; refer to Non-GAAP Definitions beginning on page 32). The Company’s forecast is based on management’s estimates as of December 31, 2025 and may be considered a forward-looking statement that is subject to risks and uncertainties. Actual results could differ materially from those projected due to various factors including, but not limited to, the risks associated with general economic and real estate conditions. For a more detailed discussion of the factors that affect operating results, interested parties should review the Tanger Inc. Annual Report on Form 10-K for the year ended December 31, 2024 and for the year ended December 31, 2025, when available. | ||||||||||||||||||||||
| (4) | Includes centers open 12 full calendar months presented on a gross basis (in alphabetical order): | ||||||||||||||||||||||
| Unconsolidated: | Charlotte, NC | Columbus, OH | Cookstown, ON | National Harbor, MD | Ottawa, ON | Texas City, TX (Houston) | |||||||||||||||||
| (5) | Includes consolidated portfolio and the Company’s pro rata share of unconsolidated joint ventures. Amounts may not recalculate due to the effect of rounding. | ||||||||||||||||||||||
7
Supplemental Operating and Financial Data for the
Quarter and Year Ended December 31, 2025
Top 25 Tenants Based on Percentage of Total Annualized Base Rent
As of December 31, 2025 (1)
At Pro Rata Share (2) | ||||||||||||||||||||||||||
| Tenant | Brands | # of Stores | GLA | % of Total GLA | % of Total Annualized Base Rent (3) | |||||||||||||||||||||
| The Gap, Inc. | Athleta, Banana Republic, Gap, Old Navy | 108 | 1,022,146 | 6.8 | % | 5.1 | % | |||||||||||||||||||
| KnitWell Group LLC; Lane Bryant Brands Opco LLC | Ann Taylor, Chicos, Lane Bryant, Loft, Soma Intimates, Talbots, White House/Black Market | 125 | 539,015 | 3.6 | % | 4.3 | % | |||||||||||||||||||
| American Eagle Outfitters, Inc. | Aerie, American Eagle Outfitters, Offline by Aerie | 61 | 364,978 | 2.4 | % | 3.1 | % | |||||||||||||||||||
| Tapestry, Inc. | Coach, Kate Spade | 65 | 289,008 | 1.9 | % | 3.1 | % | |||||||||||||||||||
| Under Armour, Inc. | Under Armour, Under Armour Youth | 37 | 317,430 | 2.1 | % | 3.0 | % | |||||||||||||||||||
| Catalyst Brands | Aéropostale, Brooks Brothers, Eddie Bauer, Lucky Brands, Nautica | 64 | 304,668 | 2.0 | % | 2.6 | % | |||||||||||||||||||
| PVH Corp. | Calvin Klein, Tommy Hilfiger | 45 | 307,293 | 2.0 | % | 2.4 | % | |||||||||||||||||||
| Nike, Inc. | Converse, Nike | 43 | 449,779 | 3.0 | % | 2.4 | % | |||||||||||||||||||
| Columbia Sportswear Company | Columbia Sportswear | 30 | 205,825 | 1.4 | % | 2.0 | % | |||||||||||||||||||
| Signet Jewelers Limited | Banter by Piercing Pagoda, Jared, Kay Jewelers, Peoples Jewellers, Zales | 58 | 119,328 | 0.8 | % | 2.0 | % | |||||||||||||||||||
| Skechers USA, Inc. | Skechers | 34 | 216,825 | 1.4 | % | 1.8 | % | |||||||||||||||||||
| Luxottica Group S.p.A. | Lenscrafters, Oakley, Sunglass Hut | 74 | 108,485 | 0.7 | % | 1.8 | % | |||||||||||||||||||
| Carter’s, Inc. | Carters, OshKosh B'gosh | 48 | 191,066 | 1.3 | % | 1.7 | % | |||||||||||||||||||
| Adidas AG | Adidas | 30 | 199,609 | 1.3 | % | 1.7 | % | |||||||||||||||||||
| Capri Holdings Limited | Michael Kors | 32 | 151,036 | 1.0 | % | 1.6 | % | |||||||||||||||||||
| Rack Room Shoes | Off Broadway Shoes, Rack Room Shoes | 26 | 171,786 | 1.1 | % | 1.6 | % | |||||||||||||||||||
| Crocs Inc. | Crocs, Hey Dude | 58 | 147,090 | 1.0 | % | 1.5 | % | |||||||||||||||||||
| Levi Strauss & Co. | Levi's | 35 | 134,985 | 0.9 | % | 1.5 | % | |||||||||||||||||||
| V. F. Corporation | The North Face, Timberland, Vans, Work Authority | 31 | 150,175 | 1.0 | % | 1.4 | % | |||||||||||||||||||
| Victoria's Secret & Co. | Pink by Victoria's Secret, Victoria's Secret | 24 | 156,771 | 1.0 | % | 1.4 | % | |||||||||||||||||||
| J.Crew Group | J.Crew Factory, J.Crew The Men's Shop, Madewell | 26 | 133,696 | 0.9 | % | 1.3 | % | |||||||||||||||||||
| Caleres Inc. | Allen Edmonds, Famous Footwear | 30 | 147,520 | 1.0 | % | 1.3 | % | |||||||||||||||||||
| Ralph Lauren Corporation | Polo Children, Polo Ralph Lauren | 35 | 389,722 | 2.6 | % | 1.2 | % | |||||||||||||||||||
| H & M Hennes & Mauritz LP. | H&M | 21 | 433,497 | 2.9 | % | 1.2 | % | |||||||||||||||||||
| Vera Bradley, Inc. | Vera Bradley | 27 | 96,280 | 0.6 | % | 1.2 | % | |||||||||||||||||||
| Total of Top 25 tenants | 1,167 | 6,748,013 | 44.7 | % | 52.2 | % | ||||||||||||||||||||
(1)Excludes leases that have been entered into but tenant has not yet taken possession, leases that have turned over but are not open, and temporary leases. Includes all retail concepts of each tenant group.
(2)Includes the Company’s pro rata share of unconsolidated joint ventures.
(3)Annualized base rent (“ABR”) is defined as the minimum monthly payments due as of the end of the reporting period annualized, excluding periodic contractual fixed increases. Includes rents that are based on a percentage of sales in lieu of fixed contractual rents and ground lease rent. No individual brand represents more than 3.0% of total ABR.
8
Supplemental Operating and Financial Data for the
Quarter and Year Ended December 31, 2025
Lease Expirations as of December 31, 2025
Percentage of Total Gross Leasable Area (1) (2)
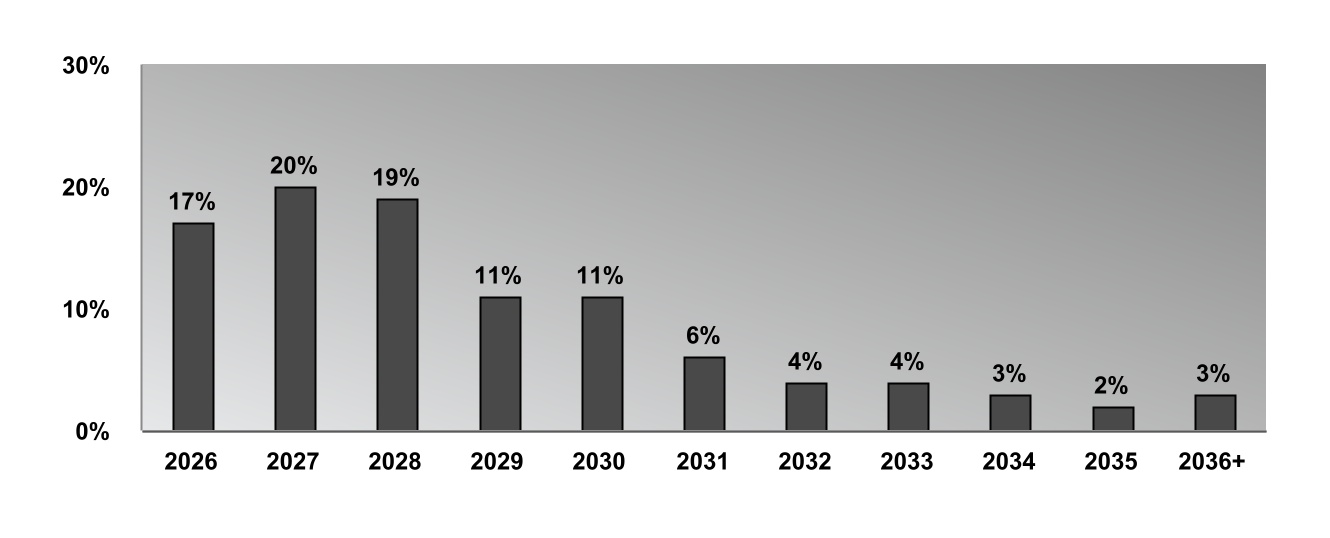
Percentage of Total Annualized Base Rent (1) (2) (3)
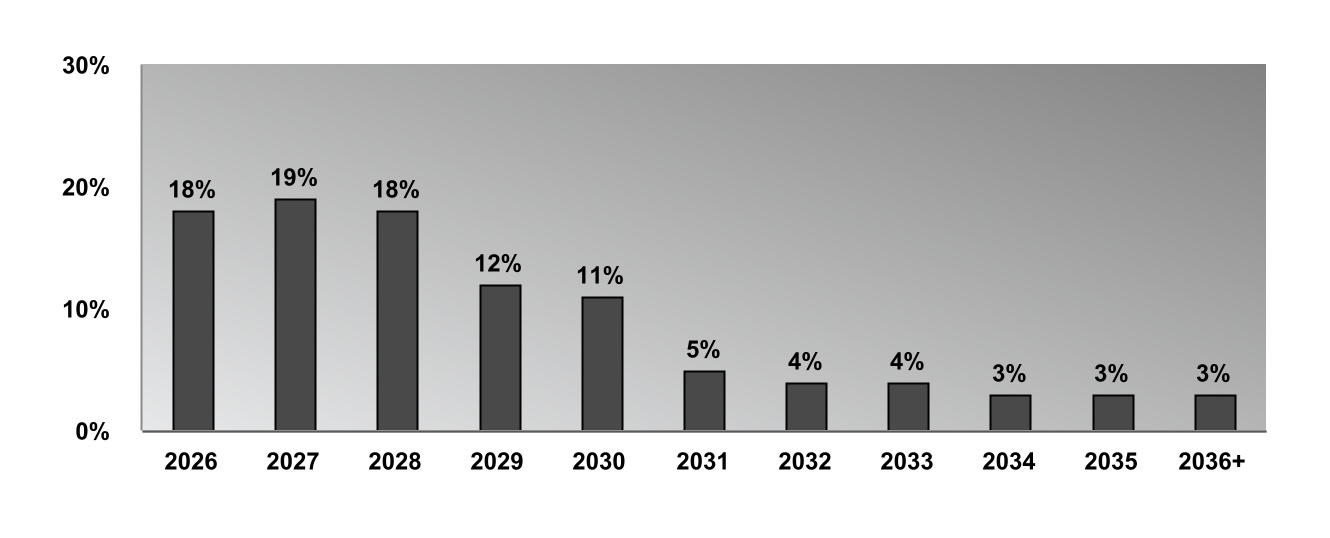
(1) Includes the Company’s pro rata share of unconsolidated joint ventures.
(2) Excludes leases that have been entered into but tenant has not yet taken possession, vacant space, leases that have turned over but are not open, temporary leases, and residential. 2026 lease expirations include month-to-month leases.
(3) Includes ground lease rent.
9
Supplemental Operating and Financial Data for the
Quarter and Year Ended December 31, 2025
Capital Expenditures for the Three Months Ended December 31, 2025 (in thousands)
| Consolidated Properties | Unconsolidated Joint Ventures at Pro Rata Share | Total at Pro Rata Share | ||||||||||||||||||
| Value-enhancing: | ||||||||||||||||||||
| New center developments, redevelopments, first generation tenant allowances and expansions | $17,424 | $19 | $17,443 | |||||||||||||||||
| Other | — | 69 | 69 | |||||||||||||||||
| Total new center developments and expansions | $17,424 | $88 | $17,512 | |||||||||||||||||
| Recurring capital expenditures: | ||||||||||||||||||||
| Second generation tenant allowances | $8,386 | $196 | $8,582 | |||||||||||||||||
| Operational capital expenditures | 17,265 | 600 | 17,865 | |||||||||||||||||
| Renovations | 2,796 | — | 2,796 | |||||||||||||||||
| Total recurring capital expenditures | $28,447 | $796 | $29,243 | |||||||||||||||||
| Total additions to rental property-accrual basis | $45,871 | $884 | $46,755 | |||||||||||||||||
Capital Expenditures for the Twelve Months Ended December 31, 2025 (in thousands)
| Consolidated Properties | Unconsolidated Joint Ventures at Pro Rata Share | Total at Pro Rata Share | ||||||||||||||||||
| Value-enhancing: | ||||||||||||||||||||
| New center developments, redevelopments, first generation tenant allowances and expansions | $32,474 | $138 | $32,612 | |||||||||||||||||
| Other | — | 69 | 69 | |||||||||||||||||
| Total new center developments and expansions | $32,474 | $207 | $32,681 | |||||||||||||||||
| Recurring capital expenditures: | ||||||||||||||||||||
| Second generation tenant allowances | $20,540 | $1,836 | $22,376 | |||||||||||||||||
| Operational capital expenditures | 37,824 | 1,459 | 39,283 | |||||||||||||||||
| Renovations | 7,497 | — | 7,497 | |||||||||||||||||
| Total recurring capital expenditures | $65,861 | $3,295 | $69,156 | |||||||||||||||||
| Total additions to rental property-accrual basis | $98,335 | $3,502 | $101,837 | |||||||||||||||||
10
Supplemental Operating and Financial Data for the
Quarter and Year Ended December 31, 2025
Transaction Summary
| Asset | Location | Type | Investment Amount (in millions) | Owned GLA (1) | Transaction Date | |||||||||||||||
| External Growth | ||||||||||||||||||||
| Tanger Outlets Nashville | Nashville, TN | Development | $145.0 | 290,667 | 10/27/2023 | |||||||||||||||
| Tanger Outlets Asheville | Asheville, NC | Acquisition | 70.0 | 376,432 | 11/13/2023 | |||||||||||||||
| Bridge Street Town Centre | Huntsville, AL | Acquisition | 193.5 | 651,016 | 11/30/2023 | |||||||||||||||
| The Promenade at Chenal | Little Rock, AR | Acquisition | 73.1 | 269,642 | 12/10/2024 | |||||||||||||||
| Pinecrest | Cleveland, OH | Acquisition | 167.0 | 638,396 | 2/12/2025 | |||||||||||||||
| Tanger Outlets Kansas City at Legends | Kansas City, KS | Acquisition | 130.0 | 688,584 | 9/16/2025 | |||||||||||||||
| Total | $778.6 | 2,914,737 | ||||||||||||||||||
| Asset | Location | Type | Sale Amount (in millions) | GLA (1) | Transaction Date | |||||||||||||||
| Disposition | ||||||||||||||||||||
Tanger Outlets Howell (2) | Howell, MI | Disposition | $17.0 | 314,438 | 4/15/2025 | |||||||||||||||
(1) Pinecrest GLA includes 100,000 square feet of residential (87 units) and 164,000 square feet of office.
(2) The Company recorded a $4.2 million non-cash impairment charge during the first quarter of 2025 as a result of this sale.
11
Supplemental Operating and Financial Data for the
Quarter and Year Ended December 31, 2025
Leasing Activity for the Trailing Twelve Months Ended December 31 - Comparable Space for Executed Leases (1) (2)
| Leasing Transactions | Square Feet (in 000s) | New Initial Rent (psf) (3) | Rent Spread % (4) | Tenant Allowance (psf) (5) | Average Initial Term (in years) | |||||||||||||||
| Total space | ||||||||||||||||||||
| 2025 | 565 | 2,773 | $39.58 | 9.5 | % | $6.67 | 4.0 | |||||||||||||
| 2024 | 473 | 2,121 | $36.76 | 15.0 | % | $3.59 | 3.3 | |||||||||||||
| Re-tenanted space | ||||||||||||||||||||
| 2025 | 72 | 356 | $50.30 | 28.3 | % | $50.64 | 8.9 | |||||||||||||
| 2024 | 26 | 130 | $47.82 | 37.5 | % | $56.86 | 8.4 | |||||||||||||
| Renewed space | ||||||||||||||||||||
| 2025 | 493 | 2,417 | $38.00 | 6.5 | % | $0.20 | 3.3 | |||||||||||||
| 2024 | 447 | 1,991 | $36.04 | 13.3 | % | $0.12 | 2.9 | |||||||||||||
Refer to footnotes below the following table.
Leasing Activity for the Trailing Twelve Months Ended December 31 - Comparable and Non-Comparable Space for Executed Leases (1) (2)
| Leasing Transactions | Square Feet (in 000s) | New Initial Rent (psf) (3) | Tenant Allowance (psf) (5) | Average Initial Term (in years) | ||||||||||||||||
| Total space | ||||||||||||||||||||
| 2025 | 630 | 3,073 | $39.97 | $11.16 | 4.4 | |||||||||||||||
| 2024 | 532 | 2,411 | $37.11 | $9.86 | 3.9 | |||||||||||||||
(1)For consolidated properties and domestic unconsolidated joint ventures at pro rata share owned as of the period-end date, except for leasing transactions, which are shown at 100%. Represents leases for new stores or renewals that were executed during the respective trailing 12-month periods and excludes license agreements, seasonal tenants, month-to-month leases, and new developments.
(2)Comparable space excludes leases for space that was vacant for more than 12 months (non-comparable space).
(3)Represents average initial cash rent (base rent and common area maintenance (“CAM”)).
(4)Represents change in average initial and expiring cash rent (base rent and CAM).
(5)Includes other landlord costs.
12
Supplemental Operating and Financial Data for the
Quarter and Year Ended December 31, 2025
Consolidated Balance Sheets (unaudited, dollars in thousands)
| December 31, | December 31, | ||||||||||
| 2025 | 2024 | ||||||||||
| Assets | |||||||||||
| Rental property: | |||||||||||
| Land | $342,203 | $311,355 | |||||||||
| Buildings, improvements and fixtures | 3,360,308 | 3,089,239 | |||||||||
| Construction in progress | 18,174 | 7,453 | |||||||||
| 3,720,685 | 3,408,047 | ||||||||||
| Accumulated depreciation | (1,513,594) | (1,428,017) | |||||||||
| Total rental property, net | 2,207,091 | 1,980,030 | |||||||||
| Cash and cash equivalents | 18,133 | 46,992 | |||||||||
| Restricted cash | 35,395 | — | |||||||||
| Investments in unconsolidated joint ventures | 64,862 | 65,665 | |||||||||
| Deferred lease costs and other intangibles, net | 110,669 | 85,028 | |||||||||
| Operating lease right-of-use assets | 83,497 | 76,099 | |||||||||
| Prepaids and other assets | 136,335 | 127,369 | |||||||||
| Total assets | $2,655,982 | $2,381,183 | |||||||||
| Liabilities and Equity | |||||||||||
| Liabilities | |||||||||||
| Debt: | |||||||||||
| Senior, unsecured notes, net | $1,043,609 | $1,041,710 | |||||||||
| Unsecured term loan, net | 323,978 | 323,182 | |||||||||
| Mortgages payable, net | 185,234 | 58,867 | |||||||||
| Unsecured lines of credit | 44,000 | — | |||||||||
| Total debt | 1,596,821 | 1,423,759 | |||||||||
| Accounts payable and accrued expenses | 133,065 | 107,775 | |||||||||
| Operating lease liabilities | 91,569 | 84,499 | |||||||||
| Other liabilities | 99,423 | 85,476 | |||||||||
| Total liabilities | 1,920,878 | 1,701,509 | |||||||||
| Commitments and contingencies | |||||||||||
| Equity | |||||||||||
| Tanger Inc.: | |||||||||||
Common shares, $0.01 par value, 300,000,000 shares authorized, 115,097,359 and 112,738,633 shares issued and outstanding at December 31, 2025 and December 31, 2024, respectively | 1,151 | 1,127 | |||||||||
| Paid in capital | 1,262,920 | 1,190,746 | |||||||||
| Accumulated distributions in excess of net income | (529,239) | (511,816) | |||||||||
| Accumulated other comprehensive loss | (28,349) | (27,687) | |||||||||
| Equity attributable to Tanger Inc. | 706,483 | 652,370 | |||||||||
| Equity attributable to noncontrolling interests: | |||||||||||
| Noncontrolling interests in Operating Partnership | 28,621 | 27,304 | |||||||||
| Noncontrolling interests in other consolidated partnerships | — | — | |||||||||
| Total equity | 735,104 | 679,674 | |||||||||
| Total liabilities and equity | $2,655,982 | $2,381,183 | |||||||||
13
Supplemental Operating and Financial Data for the
Quarter and Year Ended December 31, 2025
Consolidated Statements of Operations (unaudited, in thousands, except per share data)
| Three months ended | Year ended | ||||||||||||||||||||||
| December 31, | December 31, | ||||||||||||||||||||||
| 2025 | 2024 | 2025 | 2024 | ||||||||||||||||||||
| Revenues: | |||||||||||||||||||||||
| Rental revenue | $150,951 | $132,167 | $550,896 | $497,516 | |||||||||||||||||||
| Management, leasing and other services | 2,620 | 2,550 | 9,772 | 9,645 | |||||||||||||||||||
| Other revenue | 6,726 | 6,018 | 20,894 | 18,902 | |||||||||||||||||||
| Total revenues | 160,297 | 140,735 | 581,562 | 526,063 | |||||||||||||||||||
| Expenses: | |||||||||||||||||||||||
| Property operating | 50,500 | 45,468 | 176,502 | 158,729 | |||||||||||||||||||
General and administrative (1) | 22,123 | 21,502 | 78,722 | 78,020 | |||||||||||||||||||
| Impairment charge | — | — | 4,249 | — | |||||||||||||||||||
| Depreciation and amortization | 40,119 | 35,280 | 150,976 | 138,690 | |||||||||||||||||||
| Total expenses | 112,742 | 102,250 | 410,449 | 375,439 | |||||||||||||||||||
| Other income (expense): | |||||||||||||||||||||||
| Interest expense | (17,250) | (15,091) | (65,860) | (60,637) | |||||||||||||||||||
| Other income (expense) | 593 | 729 | 668 | 1,484 | |||||||||||||||||||
| Total other income (expense) | (16,657) | (14,362) | (65,192) | (59,153) | |||||||||||||||||||
| Income before equity in earnings of unconsolidated joint ventures | 30,898 | 24,123 | 105,921 | 91,471 | |||||||||||||||||||
| Equity in earnings of unconsolidated joint ventures | 3,926 | 3,486 | 13,580 | 11,289 | |||||||||||||||||||
| Net income | 34,824 | 27,609 | 119,501 | 102,760 | |||||||||||||||||||
| Noncontrolling interests in Operating Partnership | (1,362) | (1,123) | (4,725) | (4,245) | |||||||||||||||||||
| Noncontrolling interests in other consolidated partnerships | — | — | — | 80 | |||||||||||||||||||
| Net income attributable to Tanger Inc. | 33,462 | 26,486 | 114,776 | 98,595 | |||||||||||||||||||
| Allocation of earnings to participating securities | (221) | (228) | (872) | (920) | |||||||||||||||||||
| Net income available to common shareholders of Tanger Inc. | $33,241 | $26,258 | $113,904 | $97,675 | |||||||||||||||||||
| Basic earnings per common share: | |||||||||||||||||||||||
| Net income | $0.29 | $0.24 | $1.01 | $0.89 | |||||||||||||||||||
| Diluted earnings per common share: | |||||||||||||||||||||||
| Net income | $0.29 | $0.23 | $0.99 | $0.88 | |||||||||||||||||||
(1)The year ended December 31, 2024 includes $1.6 million of executive severance costs.
14
Supplemental Operating and Financial Data for the
Quarter and Year Ended December 31, 2025
Components of Rental Revenues (unaudited, in thousands)
As a lessor, substantially all of our revenues are earned from arrangements that are within the scope of Accounting Standards Codification Topic 842 “Leases” (“ASC 842”). We utilized the practical expedient in Accounting Standards Update (“ASU”) 2018-11 to account for lease and non-lease components as a single component, which resulted in all of our revenues associated with leases being recorded as rental revenues on the consolidated statements of operations.
The table below provides details of the components included in consolidated rental revenues:
| Three months ended | Year ended | ||||||||||||||||||||||
| December 31, | December 31, | ||||||||||||||||||||||
| 2025 | 2024 | 2025 | 2024 | ||||||||||||||||||||
| Rental revenue: | |||||||||||||||||||||||
Base rentals | $98,980 | $89,338 | $373,426 | $343,618 | |||||||||||||||||||
| Percentage rentals | 7,793 | 6,607 | 17,140 | 17,485 | |||||||||||||||||||
| Tenant expense reimbursements | 42,680 | 36,688 | 156,500 | 137,932 | |||||||||||||||||||
| Lease termination fees | 297 | 21 | 1,103 | 896 | |||||||||||||||||||
| Market rent adjustments | 246 | (42) | 710 | (157) | |||||||||||||||||||
| Straight-line rent adjustments | 1,341 | 246 | 3,410 | 607 | |||||||||||||||||||
| Uncollectible tenant revenue | (386) | (691) | (1,393) | (2,865) | |||||||||||||||||||
| Rental revenue | $150,951 | $132,167 | $550,896 | $497,516 | |||||||||||||||||||
15
Supplemental Operating and Financial Data for the
Quarter and Year Ended December 31, 2025
Unconsolidated Joint Venture Information
The following table details certain information as of December 31, 2025, except for Net Operating Income (“NOI”), which is for the year ended December 31, 2025, about various unconsolidated real estate joint ventures in which we have an ownership interest (dollars in millions):
| Joint Venture | Center Location | Tanger’s Ownership % | Square Feet | Tanger’s Pro Rata Share of Total Assets (1) | Tanger’s Pro Rata Share of NOI (2) | Tanger’s Pro Rata Share of Debt (3) | ||||||||||||||||||||||||||||||||
| Charlotte | Charlotte, NC | 50.0 | % | 398,674 | $29.5 | $9.0 | $47.9 | |||||||||||||||||||||||||||||||
| Columbus | Columbus, OH | 50.0 | % | 355,245 | 29.8 | 5.4 | 35.3 | |||||||||||||||||||||||||||||||
| Houston | Texas City, TX | 50.0 | % | 352,705 | 17.8 | 4.3 | 29.6 | |||||||||||||||||||||||||||||||
| National Harbor | National Harbor, MD | 50.0 | % | 341,156 | 33.9 | 6.6 | 45.1 | |||||||||||||||||||||||||||||||
RioCan Canada (4) | Various | 50.0 | % | 665,096 | 65.4 | 6.2 | — | |||||||||||||||||||||||||||||||
| Total | 2,112,876 | $176.4 | $31.5 | $157.9 | ||||||||||||||||||||||||||||||||||
(1)Represents Tanger’s share of total assets recorded for the unconsolidated joint ventures.
(2)NOI is calculated similarly to Portfolio NOI, a non-GAAP financial measure. Refer to Non-GAAP Definitions beginning on page 32.
(3)Net of debt origination costs and premiums.
(4)Includes a 307,883 square foot center in Cookstown, Ontario, and a 357,213 square foot center in Ottawa, Ontario.
16
Supplemental Operating and Financial Data for the
Quarter and Year Ended December 31, 2025
Debt Outstanding Summary
As of December 31, 2025
(dollars in thousands)
| Total Debt Outstanding | Pro Rata Share of Debt | Stated Interest Rate (1) | Effective Interest Rate (2) | Maturity Date (3) | Weighted Average Years to Maturity (3) | ||||||||||||||||||||||||||||||
| Consolidated Debt: | |||||||||||||||||||||||||||||||||||
| Unsecured debt: | |||||||||||||||||||||||||||||||||||
Unsecured lines of credit (4) | $44,000 | $44,000 | Adj. SOFR + 0.85% | 4.8 | % | 4/12/2029 | 3.3 | ||||||||||||||||||||||||||||
| 2026 Senior unsecured notes | 350,000 | 350,000 | 3.125% | 3.2 | % | 9/1/2026 | 0.7 | ||||||||||||||||||||||||||||
| 2027 Senior unsecured notes | 300,000 | 300,000 | 3.875% | 3.9 | % | 7/15/2027 | 1.5 | ||||||||||||||||||||||||||||
| 2031 Senior unsecured notes | 400,000 | 400,000 | 2.75% | 2.9 | % | 9/1/2031 | 5.7 | ||||||||||||||||||||||||||||
Unsecured term loan (5)(6) | 325,000 | 325,000 | Adj. SOFR + 0.94% | 4.9 | % | 1/13/2028 | 2.0 | ||||||||||||||||||||||||||||
| Debt discounts and origination costs | (7,413) | (7,413) | |||||||||||||||||||||||||||||||||
| Total unsecured debt | $1,411,587 | $1,411,587 | 3.8 | % | 2.7 | ||||||||||||||||||||||||||||||
| Secured mortgage debt: | |||||||||||||||||||||||||||||||||||
| Atlantic City, NJ | $5,705 | $5,705 | 6.44% | 5.1 | % | 12/8/2026 | 0.9 | ||||||||||||||||||||||||||||
| Kansas City, KS | 115,000 | 115,000 | 7.57% | 6.0 | % | 11/5/2027 | 1.8 | ||||||||||||||||||||||||||||
Southaven, MS (Memphis) (7) | 61,700 | 61,700 | Daily SOFR + 2.00% | 5.5 | % | 4/24/2030 | 4.3 | ||||||||||||||||||||||||||||
| Debt premium and origination costs | 2,829 | 2,829 | |||||||||||||||||||||||||||||||||
| Total secured mortgage debt | 185,234 | 185,234 | 5.8 | % | 2.7 | ||||||||||||||||||||||||||||||
| Total consolidated debt | $1,596,821 | $1,596,821 | 4.0 | % | 2.7 | ||||||||||||||||||||||||||||||
| Unconsolidated JV debt: | |||||||||||||||||||||||||||||||||||
| Charlotte, NC | $95,966 | $47,983 | 4.27% | 4.3 | % | 7/1/2028 | 2.5 | ||||||||||||||||||||||||||||
| National Harbor, MD | 90,431 | 45,216 | 4.63% | 4.6 | % | 1/5/2030 | 4.0 | ||||||||||||||||||||||||||||
| Houston, TX | 60,000 | 30,000 | Daily SOFR + 1.65% | 5.1 | % | 6/26/2030 | 4.5 | ||||||||||||||||||||||||||||
| Columbus, OH | 71,000 | 35,500 | 6.25% | 6.3 | % | 10/1/2032 | 6.8 | ||||||||||||||||||||||||||||
| Debt origination costs | (1,652) | (826) | |||||||||||||||||||||||||||||||||
| Total unconsolidated JV net debt | 315,745 | 157,873 | 5.0 | % | 4.3 | ||||||||||||||||||||||||||||||
| Total | $1,912,566 | $1,754,694 | 4.1 | % | 2.8 | ||||||||||||||||||||||||||||||
(1)Adjusted SOFR represents the Secured Overnight Financing Rate (“SOFR”) plus a 10-basis point credit adjustment spread. In January 2026, the unsecured lines of credit and unsecured term loan were amended to remove the 10-basis point credit adjustment spread. Refer to note 5 below for additional details on the unsecured term loan amendment.
(2)As of December 31, 2025. The effective interest rate includes the impact of discounts and premiums, mark-to-market adjustments for mortgages assumed in conjunction with property acquisitions and interest rate swap agreements, as applicable.
(3)Includes applicable extensions available at our option.
(4)The Company has unsecured lines of credit that provide for borrowings of up to $620.0 million, including a $20.0 million liquidity line and a $600.0 million syndicated line. A 20-basis point facility fee is due annually on the entire committed amount of each facility. In certain circumstances, total line capacity may be increased to $1.2 billion through an accordion feature in the syndicated line.
(5)In January 2026, the Company closed on $550 million of unsecured term loans, comprised of an amendment of the Company's existing $325 million term loan increasing capacity to $350 million and extending the maturity to December 2030 (the “2030 Term Loan”) and entering into a new $200 million term loan due January 2033 (the “2033 Term Loan”). The Company drew an incremental $75 million at closing, for a total outstanding of $400 million, and has a combined $150 million under a delayed draw feature, allowing the Company to draw the proceeds over a six-to-nine month period. The applicable pricing margin is SOFR plus 95 basis points for the 2030 Term Loan and SOFR plus 125 basis points for the 2033 Term Loan based on the Company’s current credit rating. The current 10-basis point SOFR credit adjustment spread was removed for the 2030 Term Loan, and the Company also amended its $600 million revolving credit facility and its $20 million liquidity line to remove the 10-basis point SOFR credit adjustment spread. Please see the Current Report on Form 8-K filed with the SEC on January 6, 2026 for additional information on this transaction. Refer to page 18 for a summary of debt outstanding pro forma for these transactions.
(6)The effective interest rate includes interest rate swap agreements that, collectively, currently fix the Daily SOFR base rate at a weighted average of 3.9% on notional amounts aggregating $325.0 million. Additional details on the Company’s interest rate strategy, including forward-starting swaps, are detailed on page 21.
(7)In December 2025, the mortgage for the Company’s Southaven, MS (Memphis) center was amended to remove the 10-basis point SOFR credit adjustment spread.
17
Supplemental Operating and Financial Data for the
Quarter and Year Ended December 31, 2025
Debt Outstanding Summary - Pro Forma for January 2026 Transactions (1)
As of December 31, 2025
(dollars in thousands)
| Total Debt Outstanding | Pro Rata Share of Debt | Stated Interest Rate (1) | Effective Interest Rate (2) | Maturity Date | Weighted Average Years to Maturity | ||||||||||||||||||||||||||||||
| Consolidated Debt: | |||||||||||||||||||||||||||||||||||
| Unsecured debt: | |||||||||||||||||||||||||||||||||||
Unsecured lines of credit (3) | $— | $— | Daily SOFR + 0.85% | 4.8 | % | 4/12/2029 | 3.3 | ||||||||||||||||||||||||||||
| 2026 Senior unsecured notes | 350,000 | 350,000 | 3.125% | 3.2 | % | 9/1/2026 | 0.7 | ||||||||||||||||||||||||||||
| 2027 Senior unsecured notes | 300,000 | 300,000 | 3.875% | 3.9 | % | 7/15/2027 | 1.5 | ||||||||||||||||||||||||||||
| 2031 Senior unsecured notes | 400,000 | 400,000 | 2.75% | 2.9 | % | 9/1/2031 | 5.7 | ||||||||||||||||||||||||||||
5-year Unsecured term loan (4) | 250,000 | 250,000 | Daily SOFR + 0.95% | 4.8 | % | 12/11/2030 | 4.9 | ||||||||||||||||||||||||||||
7-year Unsecured term loan (4) | 150,000 | 150,000 | Daily SOFR + 1.25% | 5.1 | % | 1/6/2033 | 7.0 | ||||||||||||||||||||||||||||
| Exchangeable senior notes | 250,000 | 250,000 | 2.375% | 2.4 | % | 1/15/2031 | 5.0 | ||||||||||||||||||||||||||||
| Debt discounts and origination costs | (19,375) | (19,375) | |||||||||||||||||||||||||||||||||
| Total unsecured debt | $1,680,625 | $1,680,625 | 3.6 | % | 3.8 | ||||||||||||||||||||||||||||||
| Secured mortgage debt: | |||||||||||||||||||||||||||||||||||
| Atlantic City, NJ | $5,705 | $5,705 | 6.44% | 5.1 | % | 12/8/2026 | 0.9 | ||||||||||||||||||||||||||||
| Kansas City, KS | 115,000 | 115,000 | 7.57% | 6.0 | % | 11/5/2027 | 1.8 | ||||||||||||||||||||||||||||
| Southaven, MS (Memphis) | 61,700 | 61,700 | Daily SOFR + 2.00% | 5.5 | % | 4/24/2030 | 4.3 | ||||||||||||||||||||||||||||
| Debt premium and origination costs | 2,829 | 2,829 | |||||||||||||||||||||||||||||||||
| Total secured mortgage debt | 185,234 | 185,234 | 5.8 | % | 2.7 | ||||||||||||||||||||||||||||||
| Total consolidated debt | $1,865,859 | $1,865,859 | 3.8 | % | 3.7 | ||||||||||||||||||||||||||||||
| Unconsolidated JV debt: | |||||||||||||||||||||||||||||||||||
| Charlotte, NC | $95,966 | $47,983 | 4.27% | 4.3 | % | 7/1/2028 | 2.5 | ||||||||||||||||||||||||||||
| National Harbor, MD | 90,431 | 45,216 | 4.63% | 4.6 | % | 1/5/2030 | 4.0 | ||||||||||||||||||||||||||||
| Houston, TX | 60,000 | 30,000 | Daily SOFR + 1.65% | 5.1 | % | 6/26/2030 | 4.5 | ||||||||||||||||||||||||||||
| Columbus, OH | 71,000 | 35,500 | 6.25% | 6.3 | % | 10/1/2032 | 6.8 | ||||||||||||||||||||||||||||
| Debt origination costs | (1,652) | (826) | |||||||||||||||||||||||||||||||||
| Total unconsolidated JV net debt | 315,745 | 157,873 | 5.0 | % | 4.3 | ||||||||||||||||||||||||||||||
| Total | $2,181,604 | $2,023,732 | 3.9 | % | 3.8 | ||||||||||||||||||||||||||||||
(1)This table reflects the following impacts from transactions that occurred in January 2026: (i) the amendment, expansion and extension of the Company’s existing unsecured term loan through the 2030 Term Loan as well as the removal of the 10-basis point SOFR credit adjustment spread, (ii) the entry into the 2033 Term Loan, (iii) the issuance of $250 million aggregate principal amount of 2.375% Exchangeable Senior Notes due 2031, (iv) the repayment of $44 million of borrowings under the unsecured lines of credit, and (v) approximately $12 million of origination costs associated with the issuance of the 2030 and 2033 Term Loans and the exchangeable senior notes. For additional information on these transactions, please see the Current Reports on Form 8-K filed with the SEC on January 6, 2026 and January 12, 2026.
(2)As of December 31, 2025. The effective interest rate includes the impact of discounts and premiums, mark-to-market adjustments for mortgages assumed in conjunction with property acquisitions and interest rate swap agreements, as applicable.
(3)The Company has unsecured lines of credit that provide for borrowings of up to $620.0 million, including a $20.0 million liquidity line and a $600.0 million syndicated line. A 20-basis point facility fee is due annually on the entire committed amount of each facility. In certain circumstances, total line capacity may be increased to $1.2 billion through an accordion feature in the syndicated line. Maturity date includes applicable extensions available at our option.
(4)The effective interest rate includes interest rate swap agreements that, collectively, currently fix the Daily SOFR base rate at a weighted average of 3.8% on notional amounts aggregating $400.0 million. Additional details on the Company’s interest rate strategy, including forward-starting swaps, are detailed on page 21.
18
Supplemental Operating and Financial Data for the
Quarter and Year Ended December 31, 2025
Summary of Our Share of Fixed and Variable Rate Debt, Cash and Cash Equivalents and Restricted Cash
As of December 31, 2025
(dollars in thousands)
| Debt | Total Debt % | Pro Rata Share | Effective Interest Rate (1) | Average Years to Maturity (2) | |||||||||||||||||||
| Consolidated: | |||||||||||||||||||||||
Fixed (3) | 97 | % | $1,552,821 | 4.0 | % | 2.6 | |||||||||||||||||
| Variable | 3 | % | 44,000 | 4.8 | % | 3.3 | |||||||||||||||||
| 100 | % | $1,596,821 | 4.0 | % | 2.7 | ||||||||||||||||||
| Unconsolidated Joint Ventures: | |||||||||||||||||||||||
| Fixed | 100 | % | $157,873 | 5.0 | % | 4.3 | |||||||||||||||||
| Variable | — | % | — | — | % | — | |||||||||||||||||
| 100 | % | $157,873 | 5.0 | % | 4.3 | ||||||||||||||||||
| Total: | |||||||||||||||||||||||
| Fixed | 97 | % | $1,710,694 | 4.1 | % | 2.8 | |||||||||||||||||
| Variable | 3 | % | 44,000 | 4.8 | % | 3.3 | |||||||||||||||||
| Total share of debt | 100 | % | $1,754,694 | 4.1 | % | 2.8 | |||||||||||||||||
| Cash and Cash Equivalents and Restricted Cash | Pro Rata Share | ||||||||||||||||||||||
| Consolidated: | |||||||||||||||||||||||
| Cash and cash equivalents | $18,133 | ||||||||||||||||||||||
| Restricted cash | 35,395 | ||||||||||||||||||||||
| $53,528 | |||||||||||||||||||||||
| Unconsolidated Joint ventures: | |||||||||||||||||||||||
| Cash and cash equivalents | 9,685 | ||||||||||||||||||||||
| $9,685 | |||||||||||||||||||||||
| Total: | |||||||||||||||||||||||
| Cash and cash equivalents | $27,818 | ||||||||||||||||||||||
| Restricted cash | 35,395 | ||||||||||||||||||||||
| Total share of Cash and Cash Equivalents and Restricted Cash | $63,213 | ||||||||||||||||||||||
| Net Debt | Pro Rata Share | ||||||||||||||||||||||
Total share of Net Debt (4) | $1,691,481 | ||||||||||||||||||||||
(1)As of December 31, 2025.
(2)Includes applicable extensions available at our option.
(3)The effective interest rate includes interest rate swap agreements that, collectively, currently fix the Daily SOFR base rate at a weighted average of 3.9% on notional amounts aggregating $325.0 million. Additional details on the Company’s interest rate strategy, including forward-starting swaps, are detailed on the prior page.
(4)Net debt is a non-GAAP measure. Refer to page 28 for a reconciliation of total debt to Net debt.
19
Supplemental Operating and Financial Data for the
Quarter and Year Ended December 31, 2025
Future Scheduled Principal Payments (dollars in thousands) (1)
As of December 31, 2025
| Year | Tanger Consolidated Payments | Tanger’s Pro Rata Share of Unconsolidated JV Payments | Total Scheduled Payments | Effective Interest Rate as of December 31, 2025 (2) | |||||||||||||||||||
| 2026 | $355,705 | $1,785 | $357,490 | 3.2 | % | ||||||||||||||||||
| 2027 | 415,000 | 1,865 | 416,865 | 4.5 | % | ||||||||||||||||||
| 2028 | 325,000 | 47,027 | 372,027 | 4.9 | % | ||||||||||||||||||
| 2029 | 44,000 | 984 | 44,984 | 4.8 | % | ||||||||||||||||||
| 2030 | 61,700 | 71,538 | 133,238 | 5.1 | % | ||||||||||||||||||
| 2031 | 400,000 | — | 400,000 | 2.9 | % | ||||||||||||||||||
| 2032 | — | 35,500 | 35,500 | 6.3 | % | ||||||||||||||||||
| 2033 | — | — | — | — | % | ||||||||||||||||||
| 2034 | — | — | — | — | % | ||||||||||||||||||
| 2035 & thereafter | — | — | — | — | % | ||||||||||||||||||
| Total principal outstanding | $1,601,405 | $158,699 | $1,760,104 | 4.1 | % | ||||||||||||||||||
| Net debt discounts and debt origination costs | (4,584) | (826) | (5,410) | ||||||||||||||||||||
| Total debt outstanding | $1,596,821 | $157,873 | $1,754,694 | 4.1 | % | ||||||||||||||||||
(1)Includes applicable extensions available at our option.
(2)Includes variable interest rates in effect as of December 31, 2025.
20
Supplemental Operating and Financial Data for the
Quarter and Year Ended December 31, 2025
Interest Rate Swap Strategy
(dollars in thousands)
| Interest Rate Swap Effective Date | Maturity Date | Swap Notional Amount | Bank Pay Rate | Company Fixed Pay Rate | |||||||||||||||||||||||||
| Unsecured Term Loans | |||||||||||||||||||||||||||||
| At December 31, 2025: | |||||||||||||||||||||||||||||
| February 1, 2024 | February 1, 2026 | $75,000 | Daily SOFR | 3.5 | % | ||||||||||||||||||||||||
| February 1, 2024 | August 1, 2026 | 75,000 | Daily SOFR | 3.7 | % | ||||||||||||||||||||||||
| February 1, 2024 | January 1, 2027 | 175,000 | Daily SOFR | 4.2 | % | ||||||||||||||||||||||||
| $325,000 | Daily SOFR | 3.9 | % | ||||||||||||||||||||||||||
| Forward-starting: | |||||||||||||||||||||||||||||
| January 6, 2026 | October 1, 2029 | $75,000 | Daily SOFR | 3.4 | % | ||||||||||||||||||||||||
| February 1, 2026 | April 1, 2028 | 75,000 | Daily SOFR | 3.3 | % | ||||||||||||||||||||||||
| August 1, 2026 | October 1, 2027 | 50,000 | Daily SOFR | 3.1 | % | ||||||||||||||||||||||||
| August 1, 2026 | April 1, 2028 | 25,000 | Daily SOFR | 3.1 | % | ||||||||||||||||||||||||
| January 1, 2027 | December 1, 2028 | 25,000 | Daily SOFR | 3.4 | % | ||||||||||||||||||||||||
| January 1, 2027 | September 1, 2030 | 25,000 | Daily SOFR | 3.5 | % | ||||||||||||||||||||||||
| $275,000 | 3.3 | % | |||||||||||||||||||||||||||
| Secured Mortgage Debt | |||||||||||||||||||||||||||||
| Southaven, MS (Memphis) | |||||||||||||||||||||||||||||
| May 1, 2025 | April 24, 2029 | $61,700 | Daily SOFR | 3.5 | % | ||||||||||||||||||||||||
| Houston | |||||||||||||||||||||||||||||
| June 26, 2025 | June 26, 2029 | $60,000 | Daily SOFR | 3.4 | % | ||||||||||||||||||||||||
Financial Covenants (1)
As of December 31, 2025
| Senior Unsecured Notes: | Required | Actual | |||||||||
| Total Consolidated Debt to Adjusted Total Assets | < 60% | 37 | % | ||||||||
| Total Secured Debt to Adjusted Total Assets | < 40% | 4 | % | ||||||||
| Total Unencumbered Assets to Unsecured Debt | > 150% | 277 | % | ||||||||
| Consolidated Income Available for Debt Service to Annual Debt Service Charge | > 1.5 x | 5.6 | x | ||||||||
| Unsecured Lines of Credit & Term Loan: | Required | Actual | |||||||||
| Total Liabilities to Total Adjusted Asset Value | < 60% | 35 | % | ||||||||
| Secured Indebtedness to Total Adjusted Asset Value | < 35% | 6 | % | ||||||||
| EBITDA to Fixed Charges | > 1.5 x | 4.7 | x | ||||||||
| Total Unsecured Indebtedness to Adjusted Unencumbered Asset Value | < 60% | 29 | % | ||||||||
| Unencumbered Interest Coverage Ratio | > 1.5 x | 5.8 | x | ||||||||
(1)For a complete listing of all material debt covenants related to the Company’s senior unsecured notes, unsecured lines of credit and term loan, as well as definitions of the above terms, please refer to the Company’s filings with the SEC.
Credit Ratings
| Agency | Rating | Outlook | Latest Action / Affirmation | ||||||||
| Fitch | BBB | Stable | July 24, 2025 | ||||||||
| Moody’s Investors Services | Baa2 | Stable | September 11, 2025 | ||||||||
| Standard & Poor’s Ratings Services | BBB | Stable | January 28, 2026 | ||||||||
21
Supplemental Operating and Financial Data for the
Quarter and Year Ended December 31, 2025
Enterprise Value, Net Debt, Liquidity, and Debt Ratios - December 31, 2025
(in thousands, except per share data)
| Consolidated | Pro Rata Share of Unconsolidated JVs | Total at Pro Rata Share | ||||||||||||||||||
| Enterprise Value: | ||||||||||||||||||||
| Market value: | ||||||||||||||||||||
| Common shares outstanding | 115,097 | 115,097 | ||||||||||||||||||
| Exchangeable operating partnership units | 4,663 | 4,663 | ||||||||||||||||||
Total shares and units (1) | 119,760 | 119,760 | ||||||||||||||||||
Common share price at December 31, 2025 | $33.37 | $33.37 | ||||||||||||||||||
Total market value (1) | $3,996,400 | $3,996,400 | ||||||||||||||||||
| Debt: | ||||||||||||||||||||
| Senior, unsecured notes | $1,050,000 | $— | $1,050,000 | |||||||||||||||||
| Unsecured term loan | 325,000 | — | 325,000 | |||||||||||||||||
| Mortgages payable | 182,405 | 158,699 | 341,104 | |||||||||||||||||
| Unsecured lines of credit | 44,000 | — | 44,000 | |||||||||||||||||
| Total principal debt | 1,601,405 | 158,699 | 1,760,104 | |||||||||||||||||
| Less: Net debt discounts | (472) | — | (472) | |||||||||||||||||
| Less: Debt origination costs | (4,112) | (826) | (4,938) | |||||||||||||||||
| Total debt | 1,596,821 | 157,873 | 1,754,694 | |||||||||||||||||
| Less: Cash and cash equivalents | (18,133) | (9,685) | (27,818) | |||||||||||||||||
| Less: Restricted cash | (35,395) | — | (35,395) | |||||||||||||||||
Net debt (2) | 1,543,293 | 148,188 | 1,691,481 | |||||||||||||||||
| Total enterprise value | $5,539,693 | $148,188 | $5,687,881 | |||||||||||||||||
| Liquidity | ||||||||||||||||||||
| Reported at December 31, 2025: | ||||||||||||||||||||
| Cash and cash equivalents | $18,133 | $9,685 | $27,818 | |||||||||||||||||
| Unused capacity under unsecured lines of credit | 576,000 | — | 576,000 | |||||||||||||||||
| Total liquidity (reported) | $594,133 | $9,685 | $603,818 | |||||||||||||||||
Pro Forma for January 2026 Debt Transactions (3): | ||||||||||||||||||||
| Cash and cash equivalents | $263,133 | $9,685 | $272,818 | |||||||||||||||||
| Delayed draws under the 2030 and 2033 Term Loans | 150,000 | — | 150,000 | |||||||||||||||||
| Unused capacity under unsecured lines of credit | 620,000 | — | 620,000 | |||||||||||||||||
| Total liquidity (pro forma) | $1,033,133 | $9,685 | $1,042,818 | |||||||||||||||||
Ratios (4): | ||||||||||||||||||||
Net debt to Adjusted EBITDA (2)(5) | 4.5 | x | 4.7 | x | ||||||||||||||||
Interest coverage ratio (6) | 5.2 | x | 4.8 | x | ||||||||||||||||
(1)Amounts may not recalculate due to the effect of rounding.
(2)Net debt, Adjusted EBITDA and Adjusted EBITDAre are non-GAAP measures. Refer to reconciliations of net income to Adjusted EBITDA and Adjusted EBITDAre as well as total debt to Net debt on pages 27 through 28.
(3)Reflects the following impacts from transactions that occurred in January 2026: (i) the issuance of an additional $75 million of debt under the 2030 and 2033 Term Loans, (ii) the issuance of $250 million of exchangeable notes, (iii) the repayment of $44 million of borrowings under the unsecured lines of credit, (iv) the repurchase of approximately $20 million of common shares, (v) the payment of approximately $9 million of capped call transaction costs and (vi) the payment of approximately $7 million of discounts, commissions, and offering expenses associated with the exchangeable notes issuance.
(4)Ratios are presented for the trailing twelve-month period.
(5)Net debt to Adjusted EBITDA represents Net debt for the respective portfolio divided by Adjusted EBITDA (consolidated) or Adjusted EBITDAre (total at pro rata share).
(6)Interest coverage ratio represents Adjusted EBITDA (consolidated) or Adjusted EBITDAre (total at pro rata share) divided by interest expense.
.
22
Supplemental Operating and Financial Data for the
Quarter and Year Ended December 31, 2025
NON-GAAP AND SUPPLEMENTAL MEASURES (1)
Reconciliation of Net Income to FFO and Core FFO (dollars and shares in thousands)
| Three months ended | Year ended | |||||||||||||||||||||||||
| December 31, | December 31, | |||||||||||||||||||||||||
| 2025 | 2024 | 2025 | 2024 | |||||||||||||||||||||||
| Net income | $34,824 | $27,609 | $119,501 | $102,760 | ||||||||||||||||||||||
| Adjusted for: | ||||||||||||||||||||||||||
| Depreciation and amortization of real estate assets - consolidated | 38,862 | 34,163 | 146,060 | 134,927 | ||||||||||||||||||||||
| Depreciation and amortization of real estate assets - unconsolidated joint ventures | 2,332 | 1,884 | 9,790 | 9,334 | ||||||||||||||||||||||
| Impairment charge - consolidated | — | — | 4,249 | — | ||||||||||||||||||||||
| FFO | 76,018 | 63,656 | 279,600 | 247,021 | ||||||||||||||||||||||
| FFO attributable to noncontrolling interests in other consolidated partnerships | — | — | — | 80 | ||||||||||||||||||||||
| Allocation of earnings to participating securities | (430) | (402) | (1,614) | (1,652) | ||||||||||||||||||||||
FFO available to common shareholders (2) | $75,588 | $63,254 | $277,986 | $245,449 | ||||||||||||||||||||||
| As further adjusted for: | ||||||||||||||||||||||||||
Executive departure-related adjustments (3) | — | — | — | 1,554 | ||||||||||||||||||||||
| Impact of above adjustments to the allocation of earnings to participating securities | — | — | — | (10) | ||||||||||||||||||||||
Core FFO available to common shareholders (2) | $75,588 | $63,254 | $277,986 | $246,993 | ||||||||||||||||||||||
FFO available to common shareholders per share - diluted (2) | $0.63 | $0.54 | $2.33 | $2.12 | ||||||||||||||||||||||
Core FFO available to common shareholders per share - diluted (2) | $0.63 | $0.54 | $2.33 | $2.13 | ||||||||||||||||||||||
| Weighted Average Shares: | ||||||||||||||||||||||||||
| Basic weighted average common shares | 114,607 | 111,011 | 113,172 | 109,263 | ||||||||||||||||||||||
| Effect of dilutive securities: | ||||||||||||||||||||||||||
| Equity awards | 1,592 | 1,970 | 1,555 | 1,816 | ||||||||||||||||||||||
| Diluted weighted average common shares (for earnings per share computations) | 116,199 | 112,981 | 114,727 | 111,079 | ||||||||||||||||||||||
| Exchangeable operating partnership units | 4,663 | 4,708 | 4,666 | 4,708 | ||||||||||||||||||||||
Diluted weighted average common shares (for FFO and Core FFO per share computations) (2) | 120,862 | 117,689 | 119,393 | 115,787 | ||||||||||||||||||||||
(1)Refer to Non-GAAP Definitions beginning on page 32 for definitions of the non-GAAP supplemental measures used in this report.
(2)Assumes the Class A common limited partnership units of the Operating Partnership held by the noncontrolling interests are exchanged for common shares of the Company. Each Class A common limited partnership unit is exchangeable for one of the Company’s common shares, subject to certain limitations to preserve the Company’s REIT status.
(3)For the year ended December 31, 2024, represents executive severance costs.
23
Supplemental Operating and Financial Data for the
Quarter and Year Ended December 31, 2025
Reconciliation of FFO to FAD (dollars and shares in thousands) (1)
| Three months ended | Year ended | |||||||||||||||||||||||||
| December 31, | December 31, | |||||||||||||||||||||||||
| 2025 | 2024 | 2025 | 2024 | |||||||||||||||||||||||
| FFO available to common shareholders | $75,588 | $63,254 | $277,986 | $245,449 | ||||||||||||||||||||||
| Adjusted for: | ||||||||||||||||||||||||||
| Corporate depreciation | 1,257 | 1,116 | 4,916 | 3,762 | ||||||||||||||||||||||
| Amortization of finance costs | 934 | 887 | 3,735 | 3,496 | ||||||||||||||||||||||
| Amortization of net debt discount | (229) | 199 | 321 | 747 | ||||||||||||||||||||||
| Amortization of equity-based compensation | 3,263 | 3,009 | 12,734 | 11,989 | ||||||||||||||||||||||
| Straight-line rent adjustments | (1,341) | (246) | (3,410) | (607) | ||||||||||||||||||||||
| Market rent adjustments | (154) | 135 | (339) | 528 | ||||||||||||||||||||||
| Second generation tenant allowances and lease incentives | (8,386) | (3,580) | (20,540) | (24,437) | ||||||||||||||||||||||
| Capital improvements | (20,061) | (9,687) | (45,321) | (33,395) | ||||||||||||||||||||||
| Adjustments from unconsolidated joint ventures | (804) | (1,724) | (3,159) | (2,873) | ||||||||||||||||||||||
FAD available to common shareholders (2) | $50,067 | $53,363 | $226,923 | $204,659 | ||||||||||||||||||||||
| Dividends per share | $0.2925 | $0.275 | $1.1525 | $1.085 | ||||||||||||||||||||||
| FFO payout ratio | 46 | % | 51 | % | 49 | % | 51 | % | ||||||||||||||||||
| FAD payout ratio | 71 | % | 61 | % | 61 | % | 61 | % | ||||||||||||||||||
Diluted weighted average common shares (2) | 120,862 | 117,689 | 119,393 | 115,787 | ||||||||||||||||||||||
(1)Refer to page 23 for a reconciliation of net income to FFO available to common shareholders.
(2)Assumes the Class A common limited partnership units of the Operating Partnership held by the noncontrolling interests are exchanged for common shares of the Company. Each Class A common limited partnership unit is exchangeable for one of the Company’s common shares, subject to certain limitations to preserve the Company’s REIT status.
24
Supplemental Operating and Financial Data for the
Quarter and Year Ended December 31, 2025
Reconciliation of Net Income to Portfolio NOI and Same Center NOI for the consolidated portfolio and total portfolio at pro rata share (in thousands)
| Three months ended | Year ended | |||||||||||||||||||||||||
| December 31, | December 31, | |||||||||||||||||||||||||
| 2025 | 2024 | 2025 | 2024 | |||||||||||||||||||||||
| Net income | $34,824 | $27,609 | $119,501 | $102,760 | ||||||||||||||||||||||
| Adjusted to exclude: | ||||||||||||||||||||||||||
| Equity in earnings of unconsolidated joint ventures | (3,926) | (3,486) | (13,580) | (11,289) | ||||||||||||||||||||||
| Interest expense | 17,250 | 15,091 | 65,860 | 60,637 | ||||||||||||||||||||||
| Other income | (593) | (729) | (668) | (1,484) | ||||||||||||||||||||||
| Impairment charge | — | — | 4,249 | — | ||||||||||||||||||||||
| Depreciation and amortization | 40,119 | 35,280 | 150,976 | 138,690 | ||||||||||||||||||||||
| Other non-property income | (817) | (175) | (1,648) | (1,174) | ||||||||||||||||||||||
| Corporate general and administrative expenses | 22,301 | 21,785 | 78,923 | 78,341 | ||||||||||||||||||||||
Non-cash adjustments (1) | (1,492) | (118) | (3,776) | (91) | ||||||||||||||||||||||
| Lease termination fees | (297) | (21) | (1,103) | (896) | ||||||||||||||||||||||
| Portfolio NOI - Consolidated | 107,369 | 95,236 | 398,734 | 365,494 | ||||||||||||||||||||||
| Non-same center NOI - Consolidated | (8,441) | (1,413) | (22,587) | (4,278) | ||||||||||||||||||||||
Same Center NOI - Consolidated (2) | $98,928 | $93,823 | $376,147 | $361,216 | ||||||||||||||||||||||
| Portfolio NOI - Consolidated | $107,369 | $95,236 | $398,734 | $365,494 | ||||||||||||||||||||||
Pro rata share of unconsolidated joint ventures (3) | 8,326 | 7,723 | 31,529 | 29,549 | ||||||||||||||||||||||
Portfolio NOI - Total portfolio at pro rata share (3) | 115,695 | 102,959 | 430,263 | 395,043 | ||||||||||||||||||||||
Non-same center NOI - Total portfolio at pro rata share (3) | (8,441) | (1,413) | (22,587) | (4,278) | ||||||||||||||||||||||
Same Center NOI - Total portfolio at pro rata share (2) (3) | $107,254 | $101,546 | $407,676 | $390,765 | ||||||||||||||||||||||
(1)Non-cash items include straight-line rent, above and below market rent amortization, straight-line rent expense on land leases and gains or losses on outparcel sales, as applicable.
(2)Centers excluded from Same Center NOI:
| Little Rock | December 2024 | Acquired | Consolidated | ||||||||
| Cleveland | February 2025 | Acquired | Consolidated | ||||||||
| Kansas City | September 2025 | Acquired | Consolidated | ||||||||
| Howell | April 2025 | Sold | Consolidated | ||||||||
(3) Pro rata share metrics are presented on a constant currency basis. Constant currency is a non-GAAP measure, calculated by applying the average foreign exchange rate for the current period to all periods presented.
25
Supplemental Operating and Financial Data for the
Quarter and Year Ended December 31, 2025
Same Center NOI - total portfolio at pro rata share (in thousands)
| Three months ended | Year ended | |||||||||||||||||||||||||||||||
| December 31, | % | December 31, | % | |||||||||||||||||||||||||||||
| 2025 | 2024 | Change | 2025 | 2024 | Change | |||||||||||||||||||||||||||
| Same Center Revenues: | ||||||||||||||||||||||||||||||||
| Base rentals | $96,463 | $95,056 | 1.5 | % | $374,459 | $366,983 | 2.0 | % | ||||||||||||||||||||||||
| Percentage rentals | 7,686 | 7,272 | 5.7 | % | 18,145 | 19,797 | -8.3 | % | ||||||||||||||||||||||||
| Tenant expense reimbursement | 42,603 | 40,092 | 6.3 | % | 162,734 | 151,307 | 7.6 | % | ||||||||||||||||||||||||
| Uncollectible tenant revenues | (338) | (790) | -57.2 | % | (1,283) | (3,059) | -58.1 | % | ||||||||||||||||||||||||
| Rental revenues | 146,414 | 141,630 | 3.4 | % | 554,055 | 535,028 | 3.6 | % | ||||||||||||||||||||||||
| Other revenues | 6,855 | 6,339 | 8.1 | % | 21,621 | 19,979 | 8.2 | % | ||||||||||||||||||||||||
| Total same center revenues | 153,269 | 147,969 | 3.6 | % | 575,676 | 555,007 | 3.7 | % | ||||||||||||||||||||||||
| Same Center Expenses: | ||||||||||||||||||||||||||||||||
| Property operating | 46,006 | 46,501 | -1.1 | % | 167,975 | 164,218 | 2.3 | % | ||||||||||||||||||||||||
| General and administrative | 9 | (78) | NM | 25 | 24 | 4.2 | % | |||||||||||||||||||||||||
| Total same center expenses | 46,015 | 46,423 | -0.9 | % | 168,000 | 164,242 | 2.3 | % | ||||||||||||||||||||||||
| Same Center NOI - Total portfolio at pro rata share | $107,254 | $101,546 | 5.6 | % | $407,676 | $390,765 | 4.3 | % | ||||||||||||||||||||||||
26
Supplemental Operating and Financial Data for the
Quarter and Year Ended December 31, 2025
Reconciliation of Net Income to Adjusted EBITDA and Adjusted EBITDAre (in thousands)
| Three months ended | Year ended | |||||||||||||||||||||||||
| December 31, | December 31, | |||||||||||||||||||||||||
| 2025 | 2024 | 2025 | 2024 | |||||||||||||||||||||||
| Net income | $34,824 | $27,609 | $119,501 | $102,760 | ||||||||||||||||||||||
| Adjusted to exclude: | ||||||||||||||||||||||||||
| Interest expense, net | 16,924 | 14,306 | 65,060 | 59,414 | ||||||||||||||||||||||
| Income tax expense (benefit) | 48 | 293 | 567 | 45 | ||||||||||||||||||||||
| Depreciation and amortization | 40,119 | 35,280 | 150,976 | 138,690 | ||||||||||||||||||||||
| Impairment charges - consolidated | — | — | 4,249 | — | ||||||||||||||||||||||
Executive departure-related adjustments (1) | — | — | — | 1,554 | ||||||||||||||||||||||
| Adjusted EBITDA | $91,915 | $77,488 | $340,353 | $302,463 | ||||||||||||||||||||||
| Three months ended | Year ended | |||||||||||||||||||||||||
| December 31, | December 31, | |||||||||||||||||||||||||
| 2025 | 2024 | 2025 | 2024 | |||||||||||||||||||||||
| Net income | $34,824 | $27,609 | $119,501 | $102,760 | ||||||||||||||||||||||
| Adjusted to exclude: | ||||||||||||||||||||||||||
| Interest expense, net | 16,924 | 14,306 | 65,060 | 59,414 | ||||||||||||||||||||||
| Income tax expense (benefit) | 48 | 293 | 567 | 45 | ||||||||||||||||||||||
| Depreciation and amortization | 40,119 | 35,280 | 150,976 | 138,690 | ||||||||||||||||||||||
| Impairment charges - consolidated | — | — | 4,249 | — | ||||||||||||||||||||||
| Pro rata share of interest expense, net - unconsolidated joint ventures | 1,963 | 2,186 | 8,477 | 8,725 | ||||||||||||||||||||||
Pro rata share of depreciation and amortization - unconsolidated joint ventures | 2,332 | 1,884 | 9,790 | 9,334 | ||||||||||||||||||||||
| EBITDAre | $96,210 | $81,558 | $358,620 | $318,968 | ||||||||||||||||||||||
Executive departure-related adjustments (1) | — | — | — | 1,554 | ||||||||||||||||||||||
| Adjusted EBITDAre | $96,210 | $81,558 | $358,620 | $320,522 | ||||||||||||||||||||||
(1)For the year ended December 31, 2024 period, represents executive severance costs.
27
Supplemental Operating and Financial Data for the
Quarter and Year Ended December 31, 2025
Reconciliation of Total debt to Net debt for the consolidated portfolio and total portfolio at pro rata share (in thousands)
| December 31, 2025 | ||||||||||||||||||||
| Consolidated | Pro Rata Share of Unconsolidated JVs | Total at Pro Rata Share | ||||||||||||||||||
| Total debt | $1,596,821 | $157,873 | $1,754,694 | |||||||||||||||||
| Less: | ||||||||||||||||||||
| Cash and cash equivalents | (18,133) | (9,685) | (27,818) | |||||||||||||||||
| Restricted cash | (35,395) | — | (35,395) | |||||||||||||||||
| Total cash and cash equivalents and restricted cash | (53,528) | (9,685) | (63,213) | |||||||||||||||||
| Net debt | $1,543,293 | $148,188 | $1,691,481 | |||||||||||||||||
| December 31, 2024 | ||||||||||||||||||||
| Consolidated | Pro Rata Share of Unconsolidated JVs | Total at Pro Rata Share | ||||||||||||||||||
| Total debt | $1,423,759 | $158,596 | $1,582,355 | |||||||||||||||||
| Less: | ||||||||||||||||||||
| Cash and cash equivalents | (46,992) | (8,740) | (55,732) | |||||||||||||||||
| Net debt | $1,376,767 | $149,856 | $1,526,623 | |||||||||||||||||
28
Supplemental Operating and Financial Data for the
Quarter and Year Ended December 31, 2025
Non-GAAP Pro Rata Balance Sheet Information as of December 31, 2025 (in thousands)
| Non-GAAP | |||||
Pro Rata Share of Unconsolidated Joint Ventures (1) | |||||
| Assets | |||||
| Rental property: | |||||
| Land | $39,785 | ||||
| Buildings, improvements and fixtures | 235,973 | ||||
| Construction in progress | 563 | ||||
| 276,321 | |||||
| Accumulated depreciation | (116,968) | ||||
| Total rental property, net | 159,353 | ||||
| Cash and cash equivalents | 9,685 | ||||
| Deferred lease costs and other intangibles, net | 1,350 | ||||
| Prepaids and other assets | 6,017 | ||||
| Total assets | $176,405 | ||||
| Liabilities and Owners’ Equity | |||||
| Liabilities | |||||
| Mortgages payable, net | $157,873 | ||||
| Accounts payable and accruals | 7,922 | ||||
| Total liabilities | 165,795 | ||||
| Owners’ Equity | 10,610 | ||||
| Total liabilities and owners’ equity | $176,405 | ||||
(1)The carrying value of our investments in unconsolidated joint ventures as reported in our consolidated balance sheet differs from our pro rata share of the net assets shown above due to adjustments to the book basis, including intercompany profits on sales of services that are capitalized by the unconsolidated joint ventures. The differences in basis totaled $1.9 million as of December 31, 2025 and are being amortized over the various useful lives of the related assets.
29
Supplemental Operating and Financial Data for the
Quarter and Year Ended December 31, 2025
Non-GAAP Pro Rata Statement of Operations Information for the three and twelve months ended December 31, 2025 (in thousands)
| Three months ended | Year ended | ||||||||||||||||||||||
| December 31, 2025 | December 31, 2025 | ||||||||||||||||||||||
| Non-GAAP Pro Rata Share | Non-GAAP Pro Rata Share | ||||||||||||||||||||||
| Noncontrolling Interests | Unconsolidated Joint Ventures | Noncontrolling Interests | Unconsolidated Joint Ventures | ||||||||||||||||||||
| Revenues: | |||||||||||||||||||||||
Rental revenues | $— | $12,832 | $— | $48,832 | |||||||||||||||||||
| Other revenues | — | 429 | — | 1,496 | |||||||||||||||||||
| Total revenues | — | 13,261 | — | 50,328 | |||||||||||||||||||
| Expense: | |||||||||||||||||||||||
| Property operating | — | 4,850 | — | 18,460 | |||||||||||||||||||
| General and administrative | — | 8 | — | 27 | |||||||||||||||||||
| Depreciation and amortization | — | 2,332 | — | 9,790 | |||||||||||||||||||
| Total expenses | — | 7,190 | — | 28,277 | |||||||||||||||||||
| Other income (expense): | |||||||||||||||||||||||
| Interest expense | — | (2,034) | — | (8,750) | |||||||||||||||||||
| Other income (expenses) | — | (111) | — | 279 | |||||||||||||||||||
| Total other income (expense) | — | (2,145) | — | (8,471) | |||||||||||||||||||
| Net income | $— | $3,926 | $— | $13,580 | |||||||||||||||||||
The table below provides details of the components included in our share of rental revenues for the three and twelve months ended December 31, 2025 (in thousands)
| Three months ended | Year ended | ||||||||||||||||||||||
| December 31, 2025 | December 31, 2025 | ||||||||||||||||||||||
| Non-GAAP Pro Rata Share | Non-GAAP Pro Rata Share | ||||||||||||||||||||||
| Noncontrolling Interests | Unconsolidated Joint Ventures | Noncontrolling Interests | Unconsolidated Joint Ventures | ||||||||||||||||||||
| Rental revenues: | |||||||||||||||||||||||
Base rentals | $— | $7,907 | $— | $30,042 | |||||||||||||||||||
| Percentage rentals | — | 739 | — | 2,206 | |||||||||||||||||||
| Tenant expense reimbursements | — | 4,131 | — | 16,274 | |||||||||||||||||||
| Lease termination fees | — | 36 | — | 38 | |||||||||||||||||||
| Market rent adjustments | — | — | — | — | |||||||||||||||||||
| Straight-line rent adjustments | — | 40 | — | 276 | |||||||||||||||||||
| Uncollectible tenant revenues | — | (21) | — | (4) | |||||||||||||||||||
| Rental revenues | $— | $12,832 | $— | $48,832 | |||||||||||||||||||
30
Supplemental Operating and Financial Data for the
Quarter and Year Ended December 31, 2025
Guidance for 2026
Based on the Company’s internal budgeting process and its view on current market conditions, management currently believes the Company’s full-year 2026 net income and FFO per share will be as follows:
| For the year ending December 31, 2026: | ||||||||
| Low Range | High Range | |||||||
| Estimated diluted net income per share | $1.04 | $1.12 | ||||||
| Depreciation and amortization of real estate assets - consolidated and the Company’s share of unconsolidated joint ventures | 1.37 | 1.37 | ||||||
Estimated diluted FFO per share (1) | $2.41 | $2.49 | ||||||
(1) Amounts may not recalculate due to the effect of rounding.
The above estimates reflect the following key assumptions (dollars in millions):
| For the year ending December 31, 2026: | ||||||||
| Low Range | High Range | |||||||
| Same Center NOI growth - total portfolio at pro rata share | 2.25 | % | 4.25 | % | ||||
| General and administrative expense | $80.5 | $83.5 | ||||||
| Interest expense, net of interest income - consolidated | $69.5 | $72.5 | ||||||
| Annual recurring capital expenditures, renovations and second generation tenant allowances | $65.0 | $75.0 | ||||||
Weighted average diluted common shares are expected to range from approximately 115.5 million to 116.5 million for earnings per share and 120.0 million to 121.0 million for FFO and Core FFO per share. Guidance does not include the impact of any additional acquisition or sale of any outparcels, properties or joint venture interests, or any additional financing activity.
31
Supplemental Operating and Financial Data for the
Quarter and Year Ended December 31, 2025
NON-GAAP DEFINITIONS
Funds From Operations
Funds From Operations (“FFO”) is a widely used measure of the operating performance for real estate companies that supplements net income (loss) determined in accordance with generally accepted accounting principles in the United States (“GAAP”). We determine FFO based on the definition set forth by the National Association of Real Estate Investment Trusts (“Nareit”), of which we are a member. In December 2018, Nareit issued “Nareit Funds From Operations White Paper - 2018 Restatement,” which clarifies, where necessary, existing guidance and consolidates alerts and policy bulletins into a single document for ease of use. Nareit defines FFO as net income (loss) available to the Company’s common shareholders computed in accordance with GAAP, excluding (i) depreciation and amortization related to real estate, (ii) gains or losses from sales of certain real estate assets, (iii) gains and losses from change in control, (iv) impairment write-downs of certain real estate assets and investments in entities when the impairment is directly attributable to decreases in the value of depreciable real estate held by the entity and (v) after adjustments for unconsolidated partnerships and joint ventures calculated to reflect FFO on the same basis.
FFO is intended to exclude historical cost depreciation of real estate as required by GAAP, which assumes that the value of real estate assets diminishes ratably over time. Historically, however, real estate values have risen or fallen with market conditions. Because FFO excludes depreciation and amortization of real estate assets, gains and losses from property dispositions and extraordinary items, it provides a performance measure that, when compared year over year, reflects the impact to operations from trends in occupancy rates, rental rates, operating costs, development activities and interest costs, providing perspective not immediately apparent from net income (loss).
We present FFO because we consider it an important supplemental measure of our operating performance. In addition, a portion of cash bonus compensation to certain members of management is based on our FFO or Core FFO, which is described in the section below. We believe it is useful for investors to have enhanced transparency into how we evaluate our performance and that of our management. In addition, FFO is frequently used by securities analysts, investors and other interested parties in the evaluation of REITs, many of which present FFO when reporting their results. FFO is also widely used by us and others in our industry to evaluate and price potential acquisition candidates. We believe that FFO payout ratio, which represents regular distributions to common shareholders and unitholders of the Operating Partnership expressed as a percentage of FFO, is useful to investors because it facilitates the comparison of dividend coverage between REITs. Nareit has encouraged its member companies to report their FFO as a supplemental, industry-wide standard measure of REIT operating performance.
FFO has significant limitations as an analytical tool, and you should not consider it in isolation, or as a substitute for analysis of our results as reported under GAAP. Some of these limitations are:
•FFO does not reflect our cash expenditures, or future requirements, for capital expenditures or contractual commitments;
•FFO does not reflect changes in, or cash requirements for, our working capital needs;
•Although depreciation and amortization are non-cash charges, the assets being depreciated and amortized will often have to be replaced in the future, and FFO does not reflect any cash requirements for such replacements; and
•Other companies in our industry may calculate FFO differently than we do, limiting its usefulness as a comparative measure.
Because of these limitations, FFO should not be considered as a measure of discretionary cash available to us to invest in the growth of our business or our dividend paying capacity. We compensate for these limitations by relying primarily on our GAAP results and using FFO only as a supplemental measure.
Core FFO
We present Core Funds From Operations (“Core FFO”) as a supplemental measure of our performance. We define Core FFO as FFO further adjusted to eliminate the impact of certain items that we do not consider indicative of our ongoing operating performance. These further adjustments are itemized in the table above. You are encouraged to evaluate these adjustments and the reasons we consider them appropriate for supplemental analysis. In evaluating Core FFO you should be aware that in the future we may incur expenses that are the same as or similar to some of the adjustments in this presentation. Our presentation of Core FFO should not be construed as an inference that our future results will be unaffected by unusual or non-recurring items.
We present Core FFO because we believe it assists investors and analysts in comparing our performance across reporting periods on a consistent basis by excluding items that we do not believe are indicative of our core operating performance. In addition, we believe it is useful for investors to have enhanced transparency into how we evaluate management’s performance and the effectiveness of our business strategies. We use Core FFO when certain material, unplanned transactions occur as a factor in evaluating management’s performance and to evaluate the effectiveness of our business strategies, and may use Core FFO when determining incentive compensation.
32
Supplemental Operating and Financial Data for the
Quarter and Year Ended December 31, 2025
Core FFO has limitations as an analytical tool. Some of these limitations are:
•Core FFO does not reflect our cash expenditures, or future requirements, for capital expenditures or contractual commitments;
•Core FFO does not reflect changes in, or cash requirements for, our working capital needs;
•Although depreciation and amortization are non-cash charges, the assets being depreciated and amortized will often have to be replaced in the future, and Core FFO does not reflect any cash requirements for such replacements;
•Core FFO does not reflect the impact of certain cash charges resulting from matters we consider not to be indicative of our ongoing operations; and
•Other companies in our industry may calculate Core FFO differently than we do, limiting its usefulness as a comparative measure.
Because of these limitations, Core FFO should not be considered in isolation or as a substitute for performance measures calculated in accordance with GAAP. We compensate for these limitations by relying primarily on our GAAP results and using Core FFO only as a supplemental measure.
Funds Available for Distribution
Funds Available for Distribution (“FAD”) is a non-GAAP financial measure that we define as FFO (defined as net income (loss) available to the Company’s common shareholders computed in accordance with GAAP, excluding (i) depreciation and amortization related to real estate, (ii) gains or losses from sales of certain real estate assets, (iii) gains and losses from change in control, (iv) impairment write-downs of certain real estate assets and investments in entities when the impairment is directly attributable to decreases in the value of depreciable real estate held by the entity and (v) after adjustments for unconsolidated partnerships and joint ventures calculated to reflect FFO on the same basis), excluding corporate depreciation, amortization of finance costs, amortization of net debt discount (premium), amortization of equity-based compensation, straight-line rent amounts, market rent amounts, second generation tenant allowances and lease incentives, recurring capital improvement expenditures, and our share of the items listed above for our unconsolidated joint ventures. Investors, analysts and the Company utilize FAD as an indicator of common dividend potential. The FAD payout ratio, which represents regular distributions to common shareholders and unitholders of the Operating Partnership expressed as a percentage of FAD, facilitates the comparison of dividend coverage between REITs.
We believe that net income (loss) is the most directly comparable GAAP financial measure to FAD. FAD does not represent cash generated from operating activities in accordance with GAAP and should not be considered as an alternative to net income (loss) as an indication of our performance or to cash flows as a measure of liquidity or our ability to make distributions. Other companies in our industry may calculate FAD differently than we do, limiting its usefulness as a comparative measure.
Portfolio Net Operating Income and Same Center Net Operating Income
We present portfolio net operating income (“Portfolio NOI”) and same center net operating income (“Same Center NOI”) as supplemental measures of our operating performance. Portfolio NOI represents our property level net operating income, which is defined as total operating revenues less property operating expenses and excludes termination fees and non-cash adjustments including straight-line rent, net above and below market rent amortization, impairment charges, loss on early extinguishment of debt and gains or losses on the sale of assets recognized during the periods presented. We define Same Center NOI as Portfolio NOI for the properties that were operational for the entire portion of both comparable reporting periods and which were not acquired, or subject to a material expansion or non-recurring event, such as a natural disaster, during the comparable reporting periods. We present Portfolio NOI and Same Center NOI on both a consolidated and total portfolio, including pro rata share of unconsolidated joint ventures, basis.
We believe Portfolio NOI and Same Center NOI are non-GAAP metrics used by industry analysts, investors and management to measure the operating performance of our properties because they provide performance measures directly related to the revenues and expenses involved in owning and operating real estate assets and provide a perspective not immediately apparent from net income (loss), FFO or Core FFO. Because Same Center NOI excludes properties developed, redeveloped, acquired and sold; as well as non-cash adjustments, gains or losses on the sale of outparcels and termination rents; it highlights operating trends such as occupancy levels, rental rates and operating costs on properties that were operational for both comparable periods. Portfolio NOI and Same Center NOI should not be considered alternatives to net income (loss) as an indication of our performance or to cash flows as a measure of our liquidity or our ability to make distributions. Other REITs may use different methodologies for calculating Portfolio NOI and Same Center NOI, and accordingly, our Portfolio NOI and Same Center NOI may not be comparable to other REITs.
Portfolio NOI and Same Center NOI should not be considered alternatives to net income (loss) or as an indicator of our financial performance since they do not reflect the entire operations of our portfolio, nor do they reflect the impact of general and administrative expenses, acquisition-related expenses, interest expense, depreciation and amortization costs, other non-property income and losses, the level of capital expenditures and leasing costs necessary to maintain the operating performance of our properties, or trends in development and construction activities which are significant economic costs and activities that could materially impact our results from operations. Because of these limitations, Portfolio NOI and Same Center NOI should not be viewed in isolation or as a substitute for performance measures calculated in accordance with GAAP. We compensate for these limitations by relying primarily on our GAAP results and using Portfolio NOI and Same Center NOI only as supplemental measures.
33
Supplemental Operating and Financial Data for the
Quarter and Year Ended December 31, 2025
Adjusted EBITDA, EBITDAre and Adjusted EBITDAre
We present Earnings Before Interest, Taxes, Depreciation and Amortization (“EBITDA”) as adjusted for items described below (“Adjusted EBITDA”), EBITDA for Real Estate (“EBITDAre”) and Adjusted EBITDAre, all non-GAAP measures, as supplemental measures of our operating performance. Each of these measures is defined as follows:
We define Adjusted EBITDA as net income (loss) available to the Company’s common shareholders computed in accordance with GAAP before net interest expense, income taxes (if applicable), depreciation and amortization, gains and losses on sale of operating properties, joint venture properties, outparcels and other assets, impairment write-downs of depreciated property and of investment in unconsolidated joint ventures caused by a decrease in value of depreciated property in the affiliate, compensation related to voluntary retirement plan and other executive officer severance, certain executive departure-related adjustments, gain on sale of non-real estate asset adjustments, casualty gains and losses, gains and losses on early extinguishment of debt, net and other items that we do not consider indicative of the Company’s ongoing operating performance.
We determine EBITDAre based on the definition set forth by Nareit, which is defined as net income (loss) available to the Company’s common shareholders computed in accordance with GAAP before net interest expense, income taxes (if applicable), depreciation and amortization, gains and losses on sale of operating properties, gains and losses on change of control and impairment write-downs of depreciated property and of investment in unconsolidated joint ventures caused by a decrease in value of depreciated property in the affiliate and after adjustments to reflect our share of the EBITDAre of unconsolidated joint ventures.
Adjusted EBITDAre is defined as EBITDAre excluding gains and losses on early extinguishment of debt, net, casualty gains and losses, compensation related to voluntary retirement plan and other executive officer severance, gain on sale of non-real estate asset adjustments, gains and losses on sale of outparcels, and other items that we do not consider indicative of the Company’s ongoing operating performance.
We present Adjusted EBITDA, EBITDAre and Adjusted EBITDAre as we believe they are useful for investors, creditors and rating agencies as they provide additional performance measures that are independent of a Company’s existing capital structure to facilitate the evaluation and comparison of the Company’s operating performance to other REITs and provide a more consistent metric for comparing the operating performance of the Company’s real estate between periods.
Adjusted EBITDA, EBITDAre and Adjusted EBITDAre have significant limitations as analytical tools, including:
•They do not reflect our net interest expense;
•They do not reflect gains or losses on sales of operating properties or impairment write-downs of depreciated property and of investment in unconsolidated joint ventures caused by a decrease in value of depreciated property in the affiliate;
•Adjusted EBITDA and Adjusted EBITDAre do not reflect gains and losses on extinguishment of debt and other items that may affect operations; and
•Other companies in our industry may calculate these measures differently than we do, limiting its usefulness as a comparative measure.
Because of these limitations, Adjusted EBITDA, EBITDAre and Adjusted EBITDAre should not be considered in isolation or as a substitute for performance measures calculated in accordance with GAAP. We compensate for these limitations by relying primarily on our GAAP results and using Adjusted EBITDA, EBITDAre and Adjusted EBITDAre only as supplemental measures.
Net Debt
We define Net debt as total debt less cash and cash equivalents, including restricted cash, and short-term investments and present this metric for both the consolidated portfolio and for the total portfolio, including the consolidated portfolio and the Company’s pro rata share of unconsolidated joint ventures. Net debt is a component of the Net debt to Adjusted EBITDA ratio, which is defined as Net debt for the respective portfolio divided by Adjusted EBITDA (consolidated portfolio) or Adjusted EBITDAre (total portfolio at pro rata share). We use the Net debt to Adjusted EBITDA and the Net debt to Adjusted EBITDAre ratios to evaluate the Company’s leverage. We believe this measure is an important indicator of the Company’s ability to service its long-term debt obligations.
Non-GAAP Pro Rata Balance Sheet and Income Statement Information
The pro rata balance sheet and pro rata income statement information is not, and is not intended to be, a presentation in accordance with GAAP. The pro rata balance sheet and pro rata income statement information reflect our proportionate economic ownership of each asset in our portfolio that we do not wholly own. These assets may be found in the table earlier in this report entitled, “Unconsolidated Joint Venture Information.” The amounts in the column labeled “Pro Rata Portion Unconsolidated Joint Ventures” were derived on a property-by-property basis by applying to each financial statement line item the ownership percentage interest used to arrive at our share of net income or loss during the period when applying the equity method of accounting. A similar calculation was performed for the amounts in the column labeled “Pro Rata Portion Noncontrolling interests.”
34
Supplemental Operating and Financial Data for the
Quarter and Year Ended December 31, 2025
We do not control the unconsolidated joint ventures and the presentations of the assets and liabilities and revenues and expenses do not represent our legal claim to such items. The operating agreements of the unconsolidated joint ventures generally provide that partners may receive cash distributions (1) quarterly, to the extent there is available cash from operations, (2) upon a capital event, such as a refinancing or sale or (3) upon liquidation of the venture. The amount of cash each partner receives is based upon specific provisions of each operating agreement and vary depending on factors including the amount of capital contributed by each partner and whether any contributions are entitled to priority distributions. Upon liquidation of the joint venture and after all liabilities, priority distributions and initial equity contributions have been repaid, the partners generally would be entitled to any residual cash remaining based on the legal ownership percentage shown in the table found earlier in this report entitled “Unconsolidated Joint Venture Information”.
We provide pro rata balance sheet and income statement information because we believe it assists investors and analysts in estimating our economic interest in our unconsolidated joint ventures when read in conjunction with the Company’s reported results under GAAP. The presentation of pro rata financial information has limitations as an analytical tool. Some of these limitations include:
•The amounts shown on the individual line items were derived by applying our overall economic ownership interest percentage determined when applying the equity method of accounting and do not necessarily represent our legal claim to the assets and liabilities, or the revenues and expenses; and
•Other companies in our industry may calculate their pro rata interest differently than we do, limiting the usefulness as a comparative measure.
Because of these limitations, the pro rata balance sheet and income statement information should not be considered in isolation or as a substitute for our financial statements as reported under GAAP. We compensate for these limitations by relying primarily on our GAAP results and using the pro rata balance sheet and income statement information only supplementally.
35
Supplemental Operating and Financial Data for the
Quarter and Year Ended December 31, 2025
Investor Information
Tanger® welcomes any questions or comments from shareholders, analysts, investment managers, and prospective investors. Please address all inquiries to our Investor Relations Department.
| Tanger Inc. | |||||
| Investor Relations | |||||
| Phone: | (336) 292-3010 | ||||
| Fax: | (336) 297-0931 | ||||
| E-mail: | tangerir@tanger.com | ||||
| Mail: | Tanger Inc. | ||||
| 3200 Northline Avenue | |||||
| Suite 360 | |||||
| Greensboro, NC 27408 | |||||
36
Supplemental Operating and Financial Data for the
Quarter and Year Ended December 31, 2025